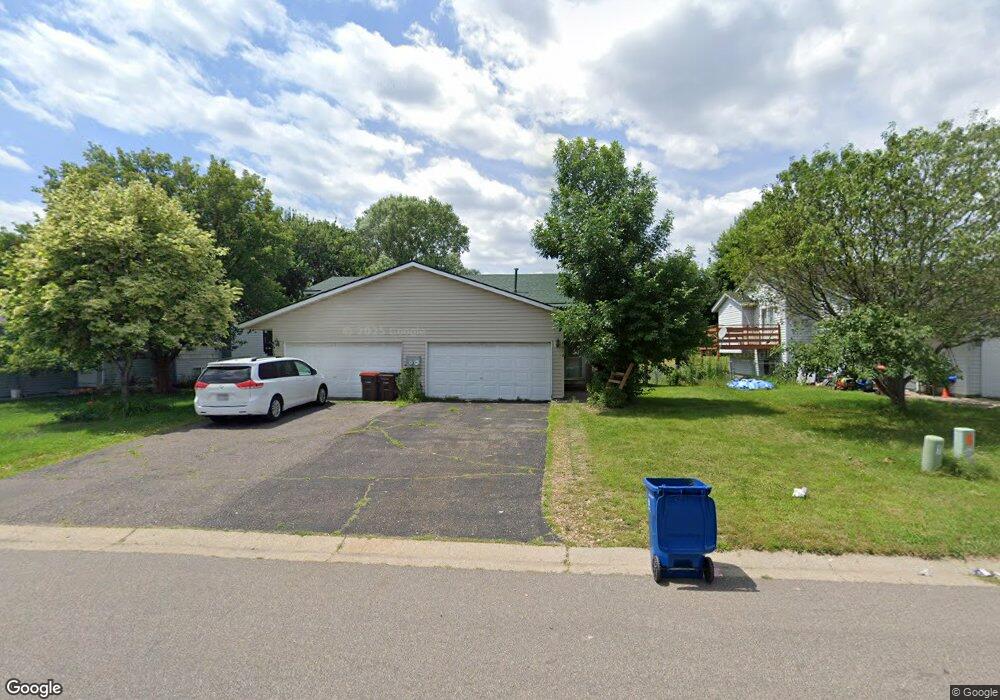
4612 Hayward Rd N Saint Paul, MN 55128
Estimated Value: $218,000 - $297,000
3
Beds
2
Baths
900
Sq Ft
$297/Sq Ft
Est. Value
About This Home
This home is located at 4612 Hayward Rd N, Saint Paul, MN 55128 and is currently estimated at $267,702, approximately $297 per square foot. 4612 Hayward Rd N is a home located in Washington County with nearby schools including Castle Elementary School, Justice Alan Page Elementary, and John Glenn Middle School.
Ownership History
Date
Name
Owned For
Owner Type
Purchase Details
Closed on
Aug 30, 2024
Sold by
Weng Di and Li Xiaoning
Bought by
Chen Huiming
Current Estimated Value
Home Financials for this Owner
Home Financials are based on the most recent Mortgage that was taken out on this home.
Original Mortgage
$165,000
Outstanding Balance
$163,145
Interest Rate
6.47%
Mortgage Type
New Conventional
Estimated Equity
$104,557
Purchase Details
Closed on
Sep 28, 2009
Sold by
Deutsche Bank National Trust Company
Bought by
Weng Di
Purchase Details
Closed on
Jun 29, 2006
Sold by
Eads Richard and Eads Sara
Bought by
Vargas Laura and Camdia Emilio
Purchase Details
Closed on
Dec 29, 2000
Sold by
Johnson Rodney A and Johnson Rebecca A
Bought by
Eads Richard and Lindstrom Sara
Purchase Details
Closed on
Jun 6, 1997
Sold by
Hud
Bought by
Johnson Rodney
Create a Home Valuation Report for This Property
The Home Valuation Report is an in-depth analysis detailing your home's value as well as a comparison with similar homes in the area
Home Values in the Area
Average Home Value in this Area
Purchase History
| Date | Buyer | Sale Price | Title Company |
|---|---|---|---|
| Chen Huiming | $220,000 | Titlesmart | |
| Weng Di | $90,000 | -- | |
| Vargas Laura | $206,400 | -- | |
| Eads Richard | $136,000 | -- | |
| Johnson Rodney | $77,500 | -- |
Source: Public Records
Mortgage History
| Date | Status | Borrower | Loan Amount |
|---|---|---|---|
| Open | Chen Huiming | $165,000 |
Source: Public Records
Tax History Compared to Growth
Tax History
| Year | Tax Paid | Tax Assessment Tax Assessment Total Assessment is a certain percentage of the fair market value that is determined by local assessors to be the total taxable value of land and additions on the property. | Land | Improvement |
|---|---|---|---|---|
| 2024 | $3,008 | $254,500 | $36,000 | $218,500 |
| 2023 | $3,008 | $251,600 | $45,000 | $206,600 |
| 2022 | $2,474 | $227,900 | $45,700 | $182,200 |
| 2021 | $2,468 | $202,000 | $40,500 | $161,500 |
| 2020 | $2,424 | $200,700 | $47,500 | $153,200 |
| 2019 | $2,258 | $193,500 | $38,000 | $155,500 |
| 2018 | $2,072 | $180,400 | $38,000 | $142,400 |
| 2017 | $2,012 | $165,600 | $32,500 | $133,100 |
| 2016 | $1,842 | $152,300 | $32,500 | $119,800 |
| 2015 | $1,786 | $141,700 | $27,000 | $114,700 |
| 2013 | -- | $131,100 | $28,100 | $103,000 |
Source: Public Records
Map
Nearby Homes
- 7050 49th St N
- 7530 Upper 42nd St N
- 7554 Upper 42nd St N
- 5187 Heath Ave N
- 4819 Grenwich Way N
- 4812 Grenwich Way N
- 7610 50th St N
- 7544 Lower 42nd N
- 7557 Lower 42nd St N
- 7541 Lower 42nd St N
- 4848 Grenwich Trail N
- 7942 42nd St N
- 7946 42nd St N
- 4880 Grenwich Trail N Unit 72E
- 4958 Grenwich Trail N
- Vanderbilt Plan at Willowbrooke - Discovery Collection
- Clearwater Plan at Willowbrooke - Discovery Collection
- Courtland II Plan at Willowbrooke - Heritage Collection
- 7632 40th St N
- Donovan Plan at Willowbrooke - Heritage Collection
- 4610 Hayward Rd N
- 4624 Hayward Rd N
- 4582 Hayward Rd N
- 4626 Hayward Rd N
- 4580 Hayward Rd N
- 4636 Hayward Rd N
- 4638 Hayward Rd N
- 4572 Hayward Rd N
- 4650 Hayward Rd N
- 4611 Hayward Rd N
- 4623 Hayward Rd N
- 4609 Hayward Rd N
- 4625 Hayward Rd N
- 4570 Hayward Rd N
- 4581 Hayward Rd N
- 4635 Hayward Rd N
- 4652 Hayward Rd N
- 4579 Hayward Rd N
- 4637 Hayward Rd N
- 4562 Hayward Rd N