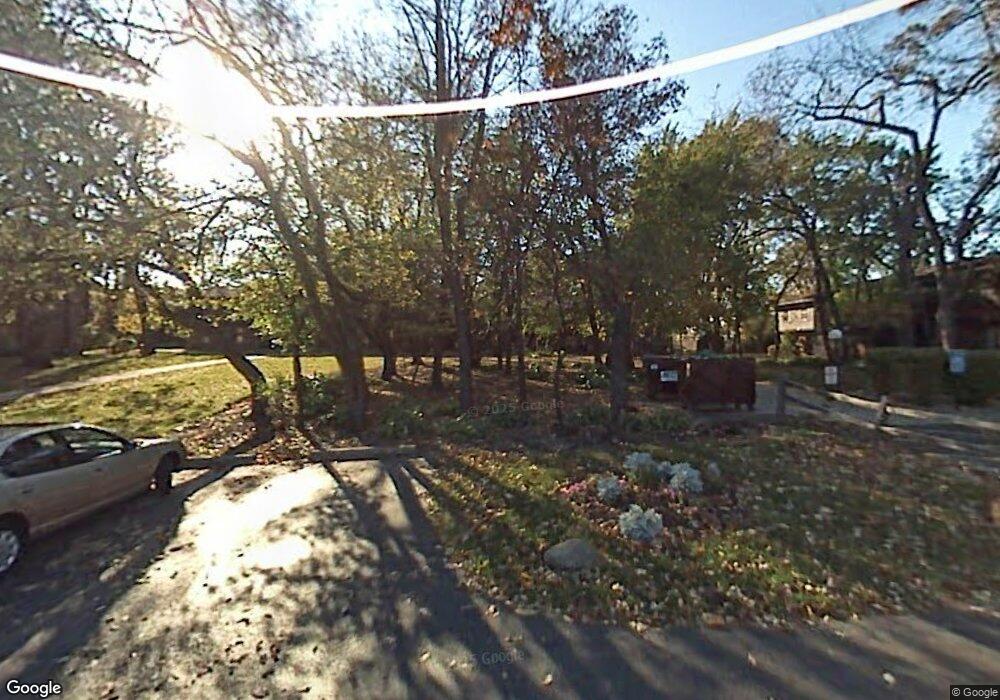
4614 W Northfox Ln Unit 2E McHenry, IL 60050
Estimated Value: $142,000 - $156,000
--
Bed
3
Baths
1,128
Sq Ft
$131/Sq Ft
Est. Value
About This Home
This home is located at 4614 W Northfox Ln Unit 2E, McHenry, IL 60050 and is currently estimated at $147,605, approximately $130 per square foot. 4614 W Northfox Ln Unit 2E is a home located in McHenry County with nearby schools including Riverwood Elementary School, Parkland School, and McHenry Community High School - Upper Campus.
Ownership History
Date
Name
Owned For
Owner Type
Purchase Details
Closed on
Dec 20, 2023
Sold by
Hayes Steven
Bought by
Hayes Jessica
Current Estimated Value
Purchase Details
Closed on
May 11, 2016
Sold by
Hayes Stevaen and Hayes Jessica
Bought by
Hayes Steven and Hayes Jessica
Purchase Details
Closed on
Aug 18, 2015
Sold by
Ulrich Jon
Bought by
Green Sharon
Purchase Details
Closed on
Jun 3, 2010
Sold by
Hayes Christine
Bought by
Hayes Steven
Purchase Details
Closed on
Jan 14, 2005
Sold by
Bower Janet M and Murray Betty L
Bought by
Hayes Wayne C
Purchase Details
Closed on
Mar 18, 1999
Sold by
Daviera Rosemary A
Bought by
Murray Betty L
Home Financials for this Owner
Home Financials are based on the most recent Mortgage that was taken out on this home.
Original Mortgage
$35,000
Interest Rate
6.89%
Create a Home Valuation Report for This Property
The Home Valuation Report is an in-depth analysis detailing your home's value as well as a comparison with similar homes in the area
Home Values in the Area
Average Home Value in this Area
Purchase History
| Date | Buyer | Sale Price | Title Company |
|---|---|---|---|
| Hayes Jessica | -- | None Listed On Document | |
| Hayes Steven | -- | None Available | |
| Green Sharon | $40,000 | Fidelity National Title | |
| Hayes Steven | -- | None Available | |
| Hayes Wayne C | $82,000 | Heritage Title Company | |
| Murray Betty L | $60,000 | -- |
Source: Public Records
Mortgage History
| Date | Status | Borrower | Loan Amount |
|---|---|---|---|
| Previous Owner | Murray Betty L | $35,000 |
Source: Public Records
Tax History Compared to Growth
Tax History
| Year | Tax Paid | Tax Assessment Tax Assessment Total Assessment is a certain percentage of the fair market value that is determined by local assessors to be the total taxable value of land and additions on the property. | Land | Improvement |
|---|---|---|---|---|
| 2024 | $2,536 | $37,975 | $5,095 | $32,880 |
| 2023 | $2,404 | $34,022 | $4,565 | $29,457 |
| 2022 | $2,011 | $27,167 | $4,235 | $22,932 |
| 2021 | $1,888 | $25,300 | $3,944 | $21,356 |
| 2020 | $1,807 | $24,246 | $3,780 | $20,466 |
| 2019 | $1,755 | $23,023 | $3,589 | $19,434 |
| 2018 | $1,415 | $18,344 | $3,426 | $14,918 |
| 2017 | $1,324 | $17,216 | $3,215 | $14,001 |
| 2016 | $1,241 | $16,090 | $3,005 | $13,085 |
| 2013 | -- | $15,840 | $2,958 | $12,882 |
Source: Public Records
Map
Nearby Homes
- 915 Royal Dr Unit 2
- 4712 W Oakwood Dr Unit 4
- 4523 W Crystal Lake Rd
- 4718 W Cumberland Cir
- 1115 N Oakwood Dr
- 4101 Crestwood St
- 604 Devonshire Ct Unit B
- 4104 W Elm St
- 1621 Meadow Ln
- 926 Front St
- 914 Front St
- 5101 W Elm St
- 5002 W Dartmoor Dr
- 419 N Thornwood Dr Unit A
- 6447 Illinois 120
- 3012 Justen Ln
- 3904 Grove Ave
- 1718 Knoll Ave
- 3937 & 3939 Main St
- 5011 Sandburg Dr
- 4614 W Northfox Ln Unit E6
- 4614 W Northfox Ln Unit E1
- 4614 W Northfox Ln Unit E3
- 4614 W Northfox Ln Unit E5
- 4614 W Northfox Ln Unit E4
- 4614 W Northfox Ln Unit E7
- 4614 W Northfox Ln Unit 8
- 4614 W Northfox Ln Unit 7
- 4614 W Northfox Ln Unit 5
- 4614 W Northfox Ln
- 4614 W Northfox Ln Unit E3
- 4614 W Northfox Ln Unit 6
- 4614 W Northfox Ln Unit 1
- 4610 W Northfox Ln Unit 5
- 4610 W Northfox Ln Unit D2
- 4610 W Northfox Ln Unit D4
- 4610 W Northfox Ln Unit D1
- 4610 W Northfox Ln Unit 3
- 4610 W Northfox Ln Unit D7
- 4610 W Northfox Ln Unit D5