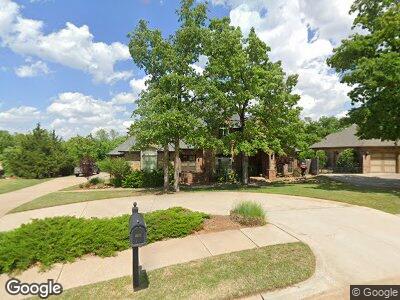
4616 Boulder Bridge Way Edmond, OK 73034
Coffee Creek NeighborhoodEstimated Value: $688,000 - $976,000
4
Beds
4
Baths
3,691
Sq Ft
$212/Sq Ft
Est. Value
About This Home
This home is located at 4616 Boulder Bridge Way, Edmond, OK 73034 and is currently estimated at $780,963, approximately $211 per square foot. 4616 Boulder Bridge Way is a home located in Oklahoma County with nearby schools including Heritage Elementary School, Sequoyah Middle School, and North High School.
Ownership History
Date
Name
Owned For
Owner Type
Purchase Details
Closed on
Mar 17, 2009
Sold by
Frisbie Terri Lynn and Kusbel Edward J
Bought by
Frisbie Terri Lynn and Kusbel Edward J
Current Estimated Value
Purchase Details
Closed on
Jun 24, 2008
Sold by
Neal Mcgee Homes Inc
Bought by
Frisbie Terri Lynn and Kusbel Edward J
Home Financials for this Owner
Home Financials are based on the most recent Mortgage that was taken out on this home.
Original Mortgage
$417,000
Interest Rate
5.87%
Mortgage Type
Purchase Money Mortgage
Purchase Details
Closed on
Jul 30, 2007
Sold by
Golden Gate Development Llc
Bought by
Neal Mcgee Homes Inc
Home Financials for this Owner
Home Financials are based on the most recent Mortgage that was taken out on this home.
Original Mortgage
$382,400
Interest Rate
6.71%
Mortgage Type
Purchase Money Mortgage
Create a Home Valuation Report for This Property
The Home Valuation Report is an in-depth analysis detailing your home's value as well as a comparison with similar homes in the area
Home Values in the Area
Average Home Value in this Area
Purchase History
| Date | Buyer | Sale Price | Title Company |
|---|---|---|---|
| Frisbie Terri Lynn | -- | American Eagle Title Ins Co | |
| Frisbie Terri Lynn | -- | American Eagle Title Ins Co | |
| Frisbie Terri Lynn | $522,000 | The Oklahoma City Abstract & | |
| Neal Mcgee Homes Inc | $55,000 | The Oklahoma City Abstract & |
Source: Public Records
Mortgage History
| Date | Status | Borrower | Loan Amount |
|---|---|---|---|
| Open | Frisbie Terri Lynn | $2,200,000 | |
| Closed | Frisbie Terri Lynn | $417,000 | |
| Closed | Frisbie Terri Lynn | $52,485 | |
| Previous Owner | Neal Mcgee Homes Inc | $382,400 |
Source: Public Records
Tax History Compared to Growth
Tax History
| Year | Tax Paid | Tax Assessment Tax Assessment Total Assessment is a certain percentage of the fair market value that is determined by local assessors to be the total taxable value of land and additions on the property. | Land | Improvement |
|---|---|---|---|---|
| 2024 | $6,045 | $60,760 | $8,651 | $52,109 |
| 2023 | $6,045 | $58,991 | $8,934 | $50,057 |
| 2022 | $5,888 | $57,273 | $10,172 | $47,101 |
| 2021 | $5,687 | $55,605 | $11,253 | $44,352 |
| 2020 | $5,686 | $54,945 | $10,745 | $44,200 |
| 2019 | $5,550 | $53,405 | $10,745 | $42,660 |
| 2018 | $5,947 | $56,815 | $0 | $0 |
| 2017 | $6,153 | $59,014 | $10,745 | $48,269 |
| 2016 | $6,070 | $58,353 | $8,525 | $49,828 |
| 2015 | $5,883 | $56,654 | $8,617 | $48,037 |
| 2014 | $5,701 | $55,004 | $9,369 | $45,635 |
Source: Public Records
Map
Nearby Homes
- 4548 Boulder Bridge Way
- 1401 Canyon Bridge Ln
- 1600 Oak Creek Dr
- 1109 Salvo Bridge Ct
- 4301 Frisco Bridge Blvd
- 1449 Narrows Bridge Cir
- 4200 Slate Bridge Rd
- 1117 Falls Bridge Ct
- 1401 Regency Bridge Cir
- 1009 Falls Bridge Ct
- 1330 Round Leaf Rd
- 1116 Gateway Bridge Rd
- 1401 Paseo Bridge Ct
- 5101 Long Branch Ln
- 508 Idabel Bridge Cir
- 1101 Gateway Bridge Rd
- 4901 Coronado Bridge Ct
- 500 Newport Bridge Dr
- 832 Gateway Bridge Rd
- 7941 Silver Spur Ct
- 4616 Boulder Bridge Way
- 4608 Boulder Bridge Way
- 4624 Boulder Bridge Way
- 4600 Boulder Bridge Way
- 4609 Boulder Bridge Way
- 4625 Frisco Bridge Blvd
- 1501 Winchester Dr
- 4624 Frisco Bridge Blvd
- 4549 Boulder Bridge Way
- 4617 Frisco Bridge Blvd
- 1500 Oak Creek Dr
- 4525 Boulder Bridge Way
- 4608 Frisco Bridge Blvd
- 4540 Boulder Bridge Way
- 1521 Winchester Dr
- 1308 Chain Bridge Ct
- 4609 Frisco Bridge Blvd
- 1500 Winchester Dr
- 4532 Boulder Bridge Way
- 4517 Boulder Bridge Way