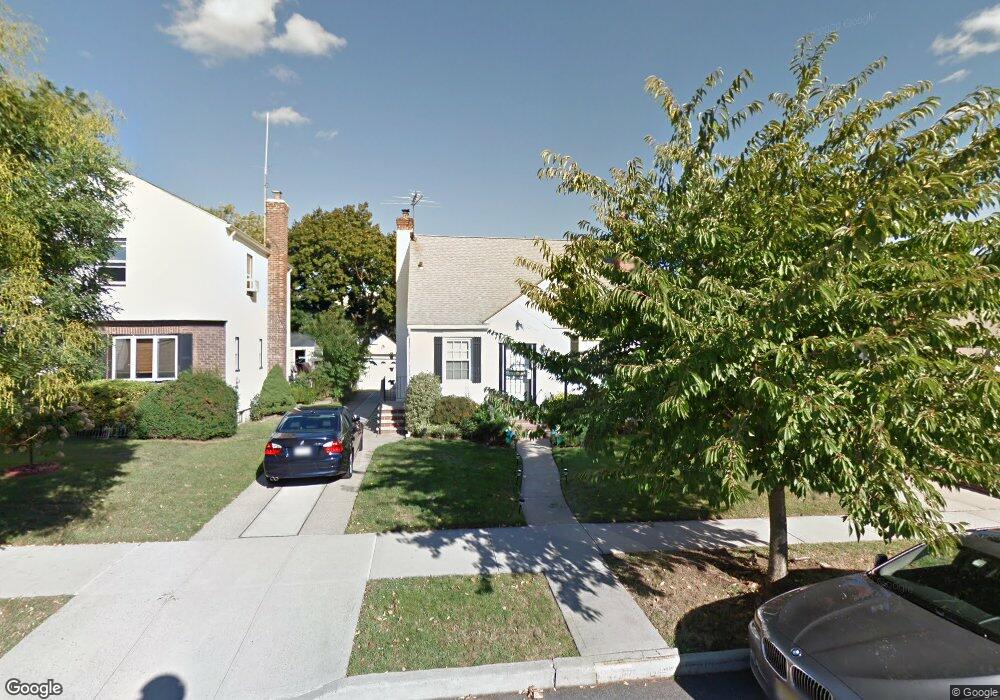
4617 196th St Flushing, NY 11358
Auburndale NeighborhoodEstimated Value: $1,018,000 - $1,078,009
4
Beds
3
Baths
1,114
Sq Ft
$939/Sq Ft
Est. Value
About This Home
This home is located at 4617 196th St, Flushing, NY 11358 and is currently estimated at $1,046,502, approximately $939 per square foot. 4617 196th St is a home located in Queens County with nearby schools including P.S. 162 The John Golden School, M.S. 158 - Marie Curie, and Francis Lewis High School.
Ownership History
Date
Name
Owned For
Owner Type
Purchase Details
Closed on
Dec 15, 2020
Sold by
Wu Xi Qin and Zhou Jin Liang
Bought by
Chen Fan Jerry and Chen Xingqi
Current Estimated Value
Home Financials for this Owner
Home Financials are based on the most recent Mortgage that was taken out on this home.
Original Mortgage
$495,000
Outstanding Balance
$440,698
Interest Rate
2.7%
Mortgage Type
New Conventional
Estimated Equity
$605,804
Purchase Details
Closed on
Apr 24, 2012
Sold by
Gokosivil Grace and Noto Josephine
Bought by
Wu Xi Qin and Zhou Jin Liang
Home Financials for this Owner
Home Financials are based on the most recent Mortgage that was taken out on this home.
Original Mortgage
$315,000
Interest Rate
4%
Mortgage Type
New Conventional
Purchase Details
Closed on
Aug 8, 2008
Sold by
Gokosivil Grace
Bought by
Gokosivil Grace and Noto Josephine
Create a Home Valuation Report for This Property
The Home Valuation Report is an in-depth analysis detailing your home's value as well as a comparison with similar homes in the area
Home Values in the Area
Average Home Value in this Area
Purchase History
| Date | Buyer | Sale Price | Title Company |
|---|---|---|---|
| Chen Fan Jerry | $845,000 | -- | |
| Wu Xi Qin | $630,000 | -- | |
| Gokosivil Grace | -- | -- |
Source: Public Records
Mortgage History
| Date | Status | Borrower | Loan Amount |
|---|---|---|---|
| Open | Chen Fan Jerry | $495,000 | |
| Previous Owner | Wu Xi Qin | $315,000 |
Source: Public Records
Tax History
| Year | Tax Paid | Tax Assessment Tax Assessment Total Assessment is a certain percentage of the fair market value that is determined by local assessors to be the total taxable value of land and additions on the property. | Land | Improvement |
|---|---|---|---|---|
| 2025 | $9,253 | $46,579 | $14,288 | $32,291 |
| 2024 | $9,253 | $46,069 | $14,941 | $31,128 |
| 2023 | $8,730 | $43,463 | $13,886 | $29,577 |
| 2022 | $8,186 | $53,580 | $18,000 | $35,580 |
| 2021 | $8,505 | $54,540 | $18,000 | $36,540 |
| 2020 | $8,216 | $49,320 | $18,000 | $31,320 |
| 2019 | $8,031 | $49,920 | $18,000 | $31,920 |
| 2018 | $7,383 | $36,219 | $13,414 | $22,805 |
| 2017 | $6,966 | $34,172 | $13,816 | $20,356 |
| 2016 | $6,733 | $34,172 | $13,816 | $20,356 |
| 2015 | $3,888 | $32,347 | $14,635 | $17,712 |
| 2014 | $3,888 | $31,993 | $15,901 | $16,092 |
Source: Public Records
Map
Nearby Homes
- 45-66 196th Place
- 4604 195th St
- 4552 196th St
- 4756 196th St
- 47-55 194th St
- 47-49 194th St
- 45-31 195th St
- 45-47 193rd St
- 199-04 47th Ave
- 47-02 Francis Lewis Blvd
- 4719 192nd St
- 4539 192nd St
- 196-64 45th Ave
- 43-44 195th St
- 47-18 190th St
- 19005 48th Ave
- 43-32 194th St
- 200-38 45th Ave
- 198-06 51st Ave
- 4818 190th St
- 46-17 196th St
- 4611 196th St
- 4621 196th St
- 46-9 196th St
- 4625 196th St
- 4607 196th St
- 4620 196th Place
- 4616 196th Place
- 4624 196th Place
- 46-24 196th Place
- 4612 196th Place
- 4629 196th St
- 4603 196th St
- 4628 196th Place
- 4628 196th Pl
- 4608 196th Place
- 4616 196th St
- 4616 196th St
- 4620 196th St
- 4632 196th Place
Your Personal Tour Guide
Ask me questions while you tour the home.