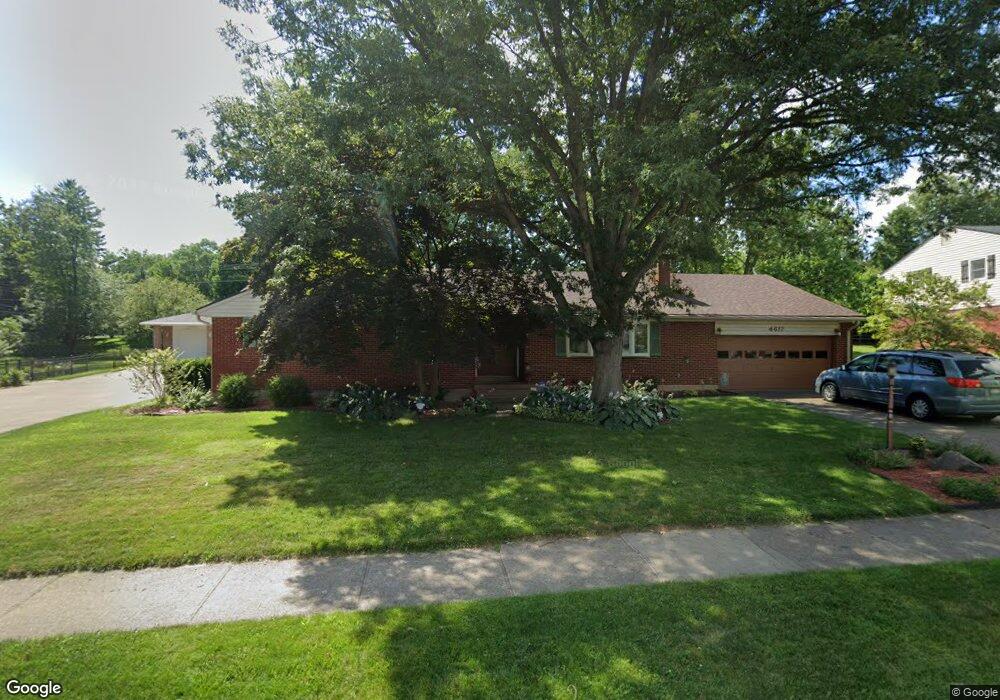
4617 Ackerman Blvd Dayton, OH 45429
Estimated Value: $344,708 - $386,000
4
Beds
2
Baths
2,238
Sq Ft
$162/Sq Ft
Est. Value
About This Home
This home is located at 4617 Ackerman Blvd, Dayton, OH 45429 and is currently estimated at $362,927, approximately $162 per square foot. 4617 Ackerman Blvd is a home located in Montgomery County with nearby schools including Oakview Elementary School, Van Buren Middle School, and Kettering Fairmont High School.
Ownership History
Date
Name
Owned For
Owner Type
Purchase Details
Closed on
Oct 16, 2009
Sold by
Fannin Mary L and Fannin Robert L
Bought by
Babel Ardath J
Current Estimated Value
Home Financials for this Owner
Home Financials are based on the most recent Mortgage that was taken out on this home.
Original Mortgage
$138,200
Interest Rate
5.15%
Mortgage Type
New Conventional
Purchase Details
Closed on
Dec 17, 2003
Sold by
Long John K And Shirley A Trs
Bought by
Ingraham Mary L
Home Financials for this Owner
Home Financials are based on the most recent Mortgage that was taken out on this home.
Original Mortgage
$166,000
Interest Rate
6.03%
Mortgage Type
Purchase Money Mortgage
Purchase Details
Closed on
Aug 1, 2001
Sold by
Long John K and Long Shirley A
Bought by
Long John K and Long Shirley A
Create a Home Valuation Report for This Property
The Home Valuation Report is an in-depth analysis detailing your home's value as well as a comparison with similar homes in the area
Home Values in the Area
Average Home Value in this Area
Purchase History
| Date | Buyer | Sale Price | Title Company |
|---|---|---|---|
| Babel Ardath J | $172,900 | Attorney | |
| Ingraham Mary L | $196,000 | -- | |
| Long John K | -- | -- |
Source: Public Records
Mortgage History
| Date | Status | Borrower | Loan Amount |
|---|---|---|---|
| Closed | Babel Ardath J | $138,200 | |
| Previous Owner | Ingraham Mary L | $166,000 |
Source: Public Records
Tax History
| Year | Tax Paid | Tax Assessment Tax Assessment Total Assessment is a certain percentage of the fair market value that is determined by local assessors to be the total taxable value of land and additions on the property. | Land | Improvement |
|---|---|---|---|---|
| 2025 | $6,425 | $100,160 | $21,040 | $79,120 |
| 2024 | $6,242 | $100,160 | $21,040 | $79,120 |
| 2023 | $6,242 | $100,160 | $21,040 | $79,120 |
| 2022 | $5,952 | $75,480 | $15,820 | $59,660 |
| 2021 | $5,507 | $75,480 | $15,820 | $59,660 |
| 2020 | $5,526 | $75,480 | $15,820 | $59,660 |
| 2019 | $4,803 | $57,930 | $14,370 | $43,560 |
| 2018 | $4,829 | $57,930 | $14,370 | $43,560 |
| 2017 | $4,450 | $57,930 | $14,370 | $43,560 |
| 2016 | $4,222 | $51,600 | $14,370 | $37,230 |
| 2015 | $4,035 | $51,600 | $14,370 | $37,230 |
| 2014 | $4,035 | $51,600 | $14,370 | $37,230 |
| 2012 | -- | $49,260 | $13,430 | $35,830 |
Source: Public Records
Map
Nearby Homes
- 4541 Acreview Ln
- 600 Laurelann Dr
- 4432 Renwood Dr
- 411 Judith Dr
- 437 Princewood Ave
- 4816 Far Hills Ave
- 935 Fairacres Dr
- 5328 Landau Dr Unit 49
- 5328 Landau Dr
- 959 Kimberly Dr
- 5380 Landau Dr Unit 40
- 4008 Ackerman Blvd
- 5416 Landau Dr Unit 7
- 1905 Tait Rd
- 1105 Chateau Dr
- 516 Oakview Dr
- 4422 Toulouse Cir
- 314 Rue Marseille
- 4441 Wehner Rd
- 4244 Flowerdale Ave
- 4601 Ackerman Blvd
- 4633 Ackerman Blvd
- 4540 Wing View Ln
- 4541 Ackerman Blvd
- 4532 Wing View Ln
- 833 Stoneybrook Dr
- 817 Stoneybrook Dr
- 4616 Wing View Ln
- 4524 Wing View Ln
- 4634 Ackerman Blvd
- 4533 Ackerman Blvd
- 801 Stoneybrook Dr
- 4601 Wing View Ln
- 4533 Wing View Ln
- 4516 Wing View Ln
- 4700 Ackerman Blvd
- 749 Stoneybrook Dr
- 4525 Ackerman Blvd
- 4609 Wing View Ln
- 4624 Wing View Ln
Your Personal Tour Guide
Ask me questions while you tour the home.