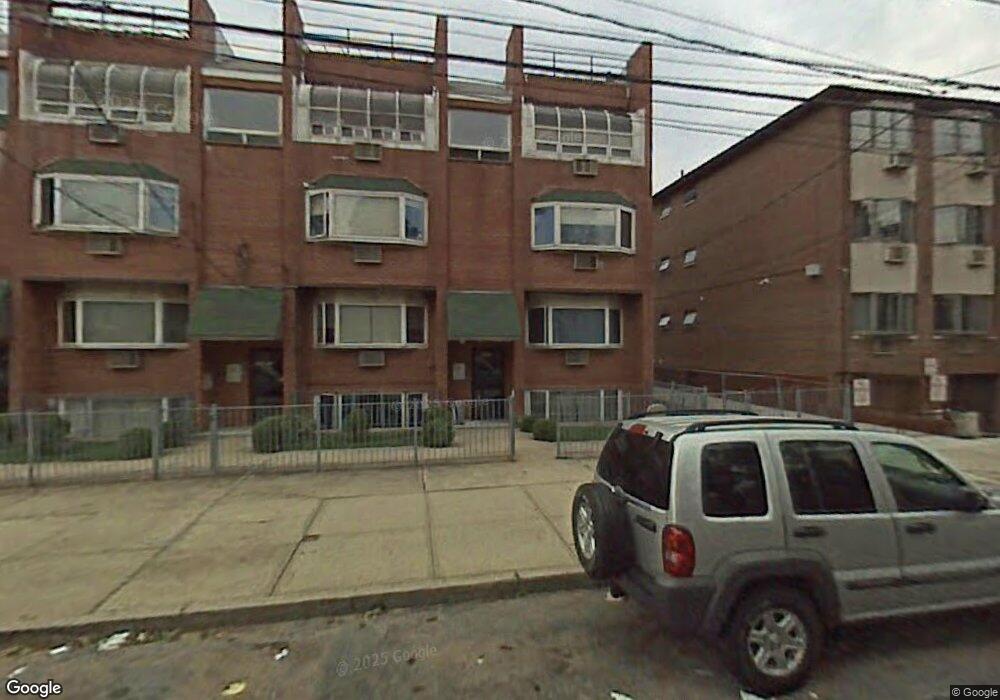
4618 161st St Unit P2 Flushing, NY 11358
Flushing Neighborhood
--
Bed
--
Bath
200
Sq Ft
7,275
Sq Ft Lot
About This Home
This home is located at 4618 161st St Unit P2, Flushing, NY 11358. 4618 161st St Unit P2 is a home located in Queens County with nearby schools including Rachel Carson I.S. 237Q, Francis Lewis High School, and Muslim Center Junior High School.
Ownership History
Date
Name
Owned For
Owner Type
Purchase Details
Closed on
Aug 23, 2024
Sold by
Rowland Stacey
Bought by
Jin Cara Ling and Lei Alan Chiao
Home Financials for this Owner
Home Financials are based on the most recent Mortgage that was taken out on this home.
Original Mortgage
$270,000
Outstanding Balance
$266,643
Interest Rate
6.78%
Mortgage Type
Purchase Money Mortgage
Purchase Details
Closed on
May 20, 2022
Sold by
Chen Chien-Huei and Lin I-Jung
Bought by
Rowland Stacey
Home Financials for this Owner
Home Financials are based on the most recent Mortgage that was taken out on this home.
Original Mortgage
$495,000
Interest Rate
5.3%
Mortgage Type
Purchase Money Mortgage
Purchase Details
Closed on
Jul 3, 2018
Sold by
Tan Johnson and Tran Frances
Bought by
Chen Chien-Huei and Lin I-Jung
Home Financials for this Owner
Home Financials are based on the most recent Mortgage that was taken out on this home.
Original Mortgage
$332,500
Interest Rate
4.5%
Mortgage Type
New Conventional
Create a Home Valuation Report for This Property
The Home Valuation Report is an in-depth analysis detailing your home's value as well as a comparison with similar homes in the area
Home Values in the Area
Average Home Value in this Area
Purchase History
| Date | Buyer | Sale Price | Title Company |
|---|---|---|---|
| Jin Cara Ling | $533,000 | -- | |
| Jin Cara Ling | $533,000 | -- | |
| Jin Cara Ling | $533,000 | -- | |
| Rowland Stacey | $550,000 | -- | |
| Rowland Stacey | $550,000 | -- | |
| Rowland Stacey | $550,000 | -- | |
| Chen Chien-Huei | $475,000 | -- | |
| Chen Chien-Huei | $475,000 | -- | |
| Chen Chien-Huei | $475,000 | -- |
Source: Public Records
Mortgage History
| Date | Status | Borrower | Loan Amount |
|---|---|---|---|
| Open | Jin Cara Ling | $270,000 | |
| Closed | Jin Cara Ling | $270,000 | |
| Previous Owner | Rowland Stacey | $495,000 | |
| Previous Owner | Chen Chien-Huei | $332,500 |
Source: Public Records
Tax History Compared to Growth
Tax History
| Year | Tax Paid | Tax Assessment Tax Assessment Total Assessment is a certain percentage of the fair market value that is determined by local assessors to be the total taxable value of land and additions on the property. | Land | Improvement |
|---|---|---|---|---|
| 2025 | $747 | $6,990 | $2,124 | $4,866 |
| 2024 | $747 | $7,048 | $2,124 | $4,924 |
| 2023 | $744 | $7,028 | $2,124 | $4,904 |
| 2022 | $751 | $7,423 | $2,124 | $5,299 |
| 2021 | $559 | $5,229 | $2,124 | $3,105 |
| 2020 | $751 | $7,592 | $2,124 | $5,468 |
| 2019 | $713 | $7,424 | $2,124 | $5,300 |
| 2018 | $676 | $6,431 | $2,125 | $4,306 |
| 2017 | $640 | $6,083 | $2,124 | $3,959 |
| 2016 | $610 | $6,083 | $2,124 | $3,959 |
| 2015 | $370 | $5,456 | $2,125 | $3,331 |
| 2014 | $370 | $5,180 | $2,124 | $3,056 |
Source: Public Records
Map
Nearby Homes
- 46-12 161st St Unit 1D
- 46-12 161st St Unit 3B
- 4620 161st St Unit B2
- 45-57 160th St
- 46-05 158th St
- 162-19 Laburnum Ave
- 46-43 157th St
- 47-18 163rd St
- 45-14 161st St
- 45-35 163rd St
- 45-11 160th St
- 157-18 Laburnum Ave
- 45-57 157th St
- 45-11 157th St
- 157-51 Rose Ave
- 148-29 Laburnum Ave
- 4344 161st St
- 4547 166th St
- 148-24 Kalmia Ave
- 14824 Kalmia Ave
- 46-18 161st St
- 4618 161st St Unit C2
- 4618 161st St Unit C1
- 4618 161st St Unit C4
- 4618 161st St Unit C3
- 46-18 161st St Unit C4
- 46-18 161st St Unit C2
- 46-18 161st St Unit C3
- 4618 161st St Unit P5
- 4618 161st St Unit P7
- 4618 161st St Unit P8
- 4618 161st St Unit P3
- 4618 161st St Unit P1
- 4620 161st St Unit B1
- 4620 161st St Unit 1A
- 4620 161st St Unit B2
- 4620 161st St Unit 4B
- 4620 161st St Unit 3B
- 4620 161st St Unit 2B
- 4620 161st St Unit B1