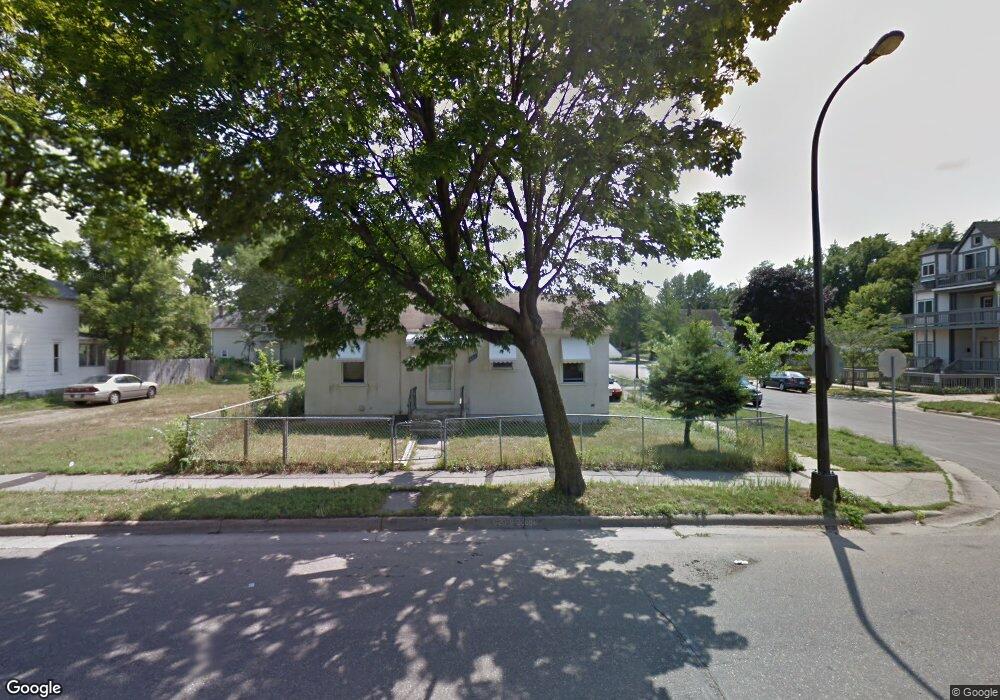
462 Case Ave Saint Paul, MN 55130
Payne-Phalen NeighborhoodEstimated Value: $209,000 - $239,000
2
Beds
1
Bath
992
Sq Ft
$232/Sq Ft
Est. Value
About This Home
This home is located at 462 Case Ave, Saint Paul, MN 55130 and is currently estimated at $229,684, approximately $231 per square foot. 462 Case Ave is a home located in Ramsey County with nearby schools including Bruce F Vento Elementary School, Washington Technology Magnet School, and Community Of Peace Academy.
Ownership History
Date
Name
Owned For
Owner Type
Purchase Details
Closed on
Mar 29, 2021
Sold by
Yang Neng
Bought by
Chang Peng
Current Estimated Value
Home Financials for this Owner
Home Financials are based on the most recent Mortgage that was taken out on this home.
Original Mortgage
$201,286
Outstanding Balance
$181,444
Interest Rate
2.9%
Mortgage Type
FHA
Estimated Equity
$48,240
Purchase Details
Closed on
Feb 22, 2017
Sold by
Lee Cha Xiong
Bought by
Yang Neng
Purchase Details
Closed on
Mar 30, 2015
Sold by
Lee Ja and Yang Mai Kao
Bought by
Lee Cha Xiong
Purchase Details
Closed on
Aug 14, 2009
Sold by
Federal National Mortgage Association
Bought by
Lee Ja
Purchase Details
Closed on
Jun 30, 2004
Sold by
Lee Yong Se and Vang Yer
Bought by
Vang Salina and Vang Sean
Create a Home Valuation Report for This Property
The Home Valuation Report is an in-depth analysis detailing your home's value as well as a comparison with similar homes in the area
Home Values in the Area
Average Home Value in this Area
Purchase History
| Date | Buyer | Sale Price | Title Company |
|---|---|---|---|
| Chang Peng | $205,000 | First American Title Ins Co | |
| Yang Neng | -- | None Available | |
| Lee Cha Xiong | $515 | None Available | |
| Lee Ja | $45,000 | -- | |
| Vang Salina | $145,000 | -- | |
| Chang Peng Peng | $205,000 | -- |
Source: Public Records
Mortgage History
| Date | Status | Borrower | Loan Amount |
|---|---|---|---|
| Open | Chang Peng | $201,286 | |
| Closed | Chang Peng Peng | $183,000 |
Source: Public Records
Tax History
| Year | Tax Paid | Tax Assessment Tax Assessment Total Assessment is a certain percentage of the fair market value that is determined by local assessors to be the total taxable value of land and additions on the property. | Land | Improvement |
|---|---|---|---|---|
| 2025 | $3,188 | $224,500 | $25,000 | $199,500 |
| 2023 | $3,188 | $209,200 | $20,000 | $189,200 |
| 2022 | $2,422 | $211,400 | $20,000 | $191,400 |
| 2021 | $2,440 | $165,800 | $20,000 | $145,800 |
| 2020 | $2,116 | $124,800 | $6,900 | $117,900 |
| 2019 | $1,608 | $104,000 | $6,900 | $97,100 |
| 2018 | $1,464 | $80,000 | $6,900 | $73,100 |
| 2017 | $1,476 | $73,900 | $6,900 | $67,000 |
| 2016 | $1,310 | $0 | $0 | $0 |
| 2015 | $1,286 | $58,300 | $6,900 | $51,400 |
| 2014 | $1,470 | $0 | $0 | $0 |
Source: Public Records
Map
Nearby Homes
Your Personal Tour Guide
Ask me questions while you tour the home.