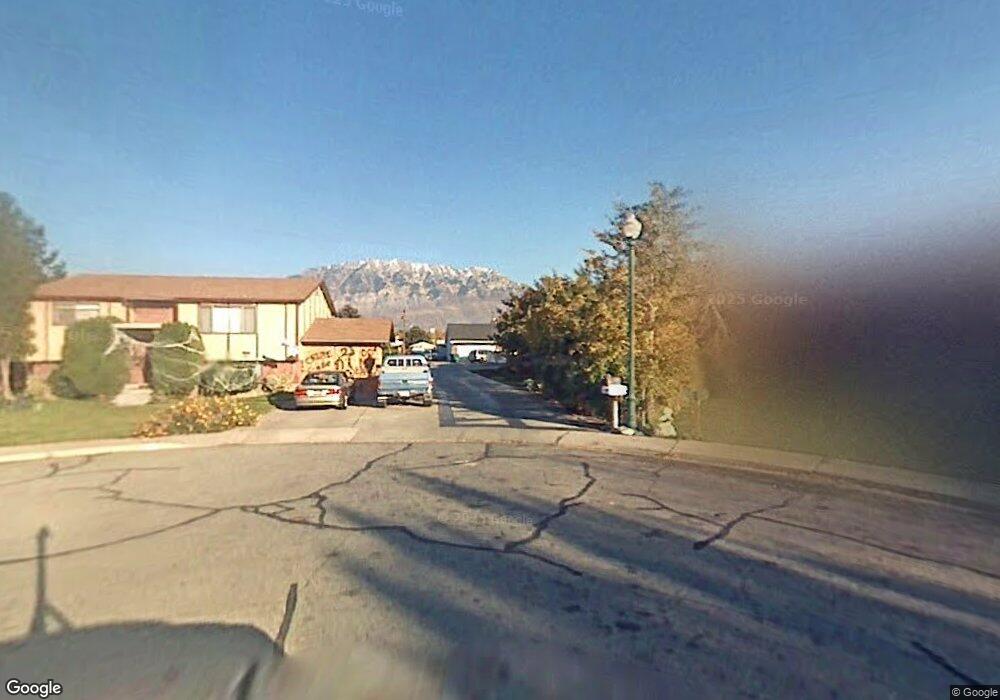
462 N 680 W Orem, UT 84057
Geneva NeighborhoodEstimated Value: $460,000 - $513,000
3
Beds
3
Baths
1,236
Sq Ft
$400/Sq Ft
Est. Value
About This Home
This home is located at 462 N 680 W, Orem, UT 84057 and is currently estimated at $494,615, approximately $400 per square foot. 462 N 680 W is a home located in Utah County with nearby schools including Orem Junior High School, Timpanogos High School, and Noah Webster Academy.
Ownership History
Date
Name
Owned For
Owner Type
Purchase Details
Closed on
Aug 1, 2003
Sold by
Johansen Darren J
Bought by
Johansen Darren J and Johansen Heather Danielle
Current Estimated Value
Purchase Details
Closed on
Sep 4, 2001
Sold by
Bocanegra Jamie
Bought by
Bocanegra Mark Harold and Bocanegra Jamie
Purchase Details
Closed on
Aug 27, 2001
Sold by
Johansen Darren J and Johansen Heather
Bought by
Bocanegra Jamie
Purchase Details
Closed on
Sep 30, 1996
Sold by
Johansen Darren J
Bought by
Johansen Darren J and Johansen Heather
Home Financials for this Owner
Home Financials are based on the most recent Mortgage that was taken out on this home.
Original Mortgage
$100,000
Interest Rate
7.95%
Create a Home Valuation Report for This Property
The Home Valuation Report is an in-depth analysis detailing your home's value as well as a comparison with similar homes in the area
Home Values in the Area
Average Home Value in this Area
Purchase History
| Date | Buyer | Sale Price | Title Company |
|---|---|---|---|
| Johansen Darren J | -- | Inwest Title Services Inc | |
| Bocanegra Mark Harold | -- | Inwest Title Services Inc | |
| Bocanegra Jamie | -- | -- | |
| Johansen Darren J | -- | -- |
Source: Public Records
Mortgage History
| Date | Status | Borrower | Loan Amount |
|---|---|---|---|
| Previous Owner | Johansen Darren J | $100,000 |
Source: Public Records
Tax History
| Year | Tax Paid | Tax Assessment Tax Assessment Total Assessment is a certain percentage of the fair market value that is determined by local assessors to be the total taxable value of land and additions on the property. | Land | Improvement |
|---|---|---|---|---|
| 2025 | $328 | $266,970 | -- | -- |
| 2024 | $328 | $248,050 | $0 | $0 |
| 2023 | $229 | $248,875 | $0 | $0 |
| 2022 | $1,851 | $235,620 | $0 | $0 |
| 2021 | $1,690 | $325,900 | $123,300 | $202,600 |
| 2020 | $1,558 | $295,300 | $98,600 | $196,700 |
| 2019 | $1,498 | $295,300 | $98,600 | $196,700 |
| 2018 | $1,411 | $265,800 | $94,800 | $171,000 |
| 2017 | $1,322 | $133,320 | $0 | $0 |
| 2016 | $1,271 | $118,195 | $0 | $0 |
| 2015 | $1,252 | $110,165 | $0 | $0 |
| 2014 | $1,230 | $107,690 | $0 | $0 |
Source: Public Records
Map
Nearby Homes
- 474 N Emery Ave
- 574 N 600 W
- 489 N Beverly Ave
- 557 N Emery Ave
- 776 W 640 N
- 875 W 530 N
- 686 N 835 W
- 342 W 350 N
- 954 W 630 N Unit 34,
- 162 N 450 W Unit 2
- 285 N 300 W
- 597 N State St Unit 25
- 645 W 920 N
- 1058 W 570 St N
- 241 W 310 St N
- 1094 W 465 N
- 508 W 40 N
- 565 W 40 N
- 222 N 1200 W Unit 144
- 222 N 1200 W Unit 53
Your Personal Tour Guide
Ask me questions while you tour the home.