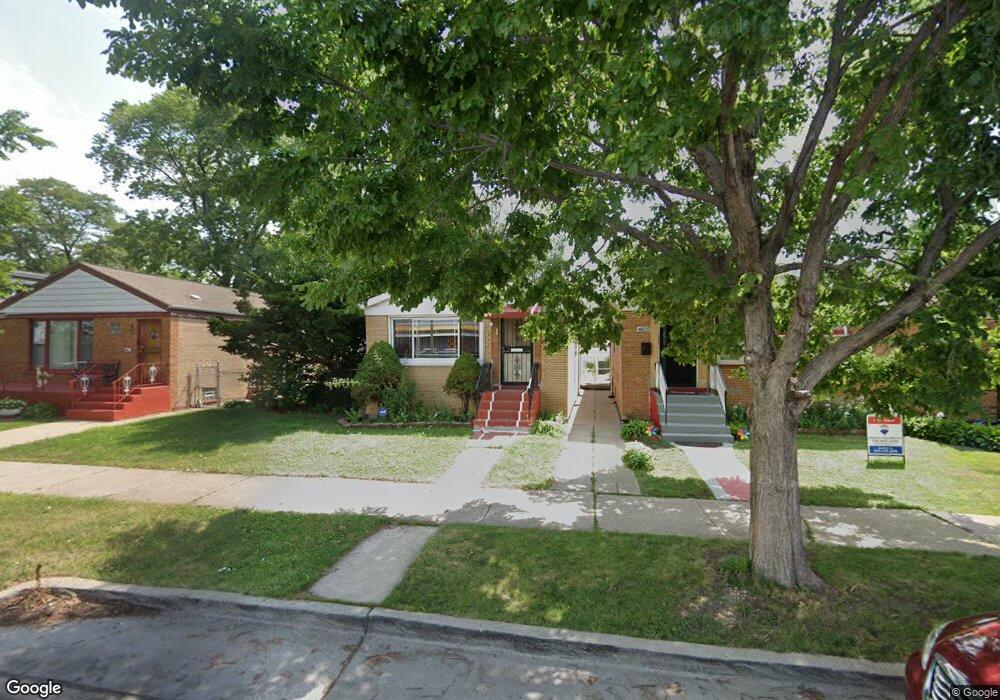
4621 S Laramie Ave Chicago, IL 60638
Garfield Ridge NeighborhoodEstimated Value: $253,000 - $286,000
2
Beds
1
Bath
1,020
Sq Ft
$262/Sq Ft
Est. Value
About This Home
This home is located at 4621 S Laramie Ave, Chicago, IL 60638 and is currently estimated at $267,182, approximately $261 per square foot. 4621 S Laramie Ave is a home located in Cook County with nearby schools including Hearst Elementary School, Kennedy High School, and Academy for Global Citizenship.
Ownership History
Date
Name
Owned For
Owner Type
Purchase Details
Closed on
Jan 30, 2015
Sold by
Love Ted and Love Judith
Bought by
Love Theodore and Love Judith
Current Estimated Value
Home Financials for this Owner
Home Financials are based on the most recent Mortgage that was taken out on this home.
Original Mortgage
$45,775
Outstanding Balance
$35,138
Interest Rate
3.82%
Mortgage Type
New Conventional
Estimated Equity
$232,044
Purchase Details
Closed on
Jun 27, 2000
Sold by
Conseco Finance Servicing Corp
Bought by
Love Ted
Home Financials for this Owner
Home Financials are based on the most recent Mortgage that was taken out on this home.
Original Mortgage
$53,600
Interest Rate
8.55%
Mortgage Type
Balloon
Purchase Details
Closed on
May 13, 2000
Sold by
Honorable Allen
Bought by
Green Tree Financial Servicing Corp and Conseco Financial Servicing Corp
Home Financials for this Owner
Home Financials are based on the most recent Mortgage that was taken out on this home.
Original Mortgage
$53,600
Interest Rate
8.55%
Mortgage Type
Balloon
Create a Home Valuation Report for This Property
The Home Valuation Report is an in-depth analysis detailing your home's value as well as a comparison with similar homes in the area
Home Values in the Area
Average Home Value in this Area
Purchase History
| Date | Buyer | Sale Price | Title Company |
|---|---|---|---|
| Love Theodore | -- | Mortgage Connect Lp | |
| Love Ted | -- | -- | |
| Green Tree Financial Servicing Corp | -- | -- |
Source: Public Records
Mortgage History
| Date | Status | Borrower | Loan Amount |
|---|---|---|---|
| Open | Love Theodore | $45,775 | |
| Closed | Love Ted | $53,600 |
Source: Public Records
Tax History Compared to Growth
Tax History
| Year | Tax Paid | Tax Assessment Tax Assessment Total Assessment is a certain percentage of the fair market value that is determined by local assessors to be the total taxable value of land and additions on the property. | Land | Improvement |
|---|---|---|---|---|
| 2024 | $2,676 | $21,000 | $3,780 | $17,220 |
| 2023 | $2,587 | $16,001 | $2,993 | $13,008 |
| 2022 | $2,587 | $16,001 | $2,993 | $13,008 |
| 2021 | $2,548 | $15,999 | $2,992 | $13,007 |
| 2020 | $1,265 | $8,780 | $2,992 | $5,788 |
| 2019 | $1,271 | $9,756 | $2,992 | $6,764 |
| 2018 | $1,249 | $9,756 | $2,992 | $6,764 |
| 2017 | $1,887 | $12,143 | $2,677 | $9,466 |
| 2016 | $1,932 | $12,143 | $2,677 | $9,466 |
| 2015 | $1,744 | $12,143 | $2,677 | $9,466 |
| 2014 | $1,466 | $10,469 | $2,520 | $7,949 |
| 2013 | $1,426 | $10,469 | $2,520 | $7,949 |
Source: Public Records
Map
Nearby Homes
- 4613 S Laramie Ave
- 4625 S Laramie Ave
- 4540 S Leclaire Ave
- 4531 S Lawler Ave
- 4745 S Leamington Ave
- 4432 S Leclaire Ave
- 4436 S Leclaire Ave
- 4439 S Lawler Ave
- 4756 S Lockwood Ave
- 4548 S Laporte Ave
- 4818 S Lavergne Ave
- 4725 S Laporte Ave
- 4857 S Lorel Ave
- 4804 S Lamon Ave
- 4821 S Lotus Ave
- 7033 W 43rd St
- 4919 S Long Ave
- 4924 S Lorel Ave
- 4824 S La Crosse Ave
- 5001 S Latrobe Ave
- 4621 S Laramie Ave
- 4627 S Laramie Ave
- 4617 S Laramie Ave
- 4633 S Laramie Ave
- 4635 S Laramie Ave
- 4637 S Laramie Ave
- 4622 S Leamington Ave
- 4626 S Leamington Ave
- 4620 S Leamington Ave
- 4609 S Laramie Ave
- 4628 S Leamington Ave
- 4639 S Laramie Ave
- 4616 S Leamington Ave
- 4632 S Leamington Ave
- 4614 S Leamington Ave
- 4607 S Laramie Ave
- 4634 S Leamington Ave
- 4610 S Leamington Ave
- 4643 S Laramie Ave
- 4638 S Leamington Ave