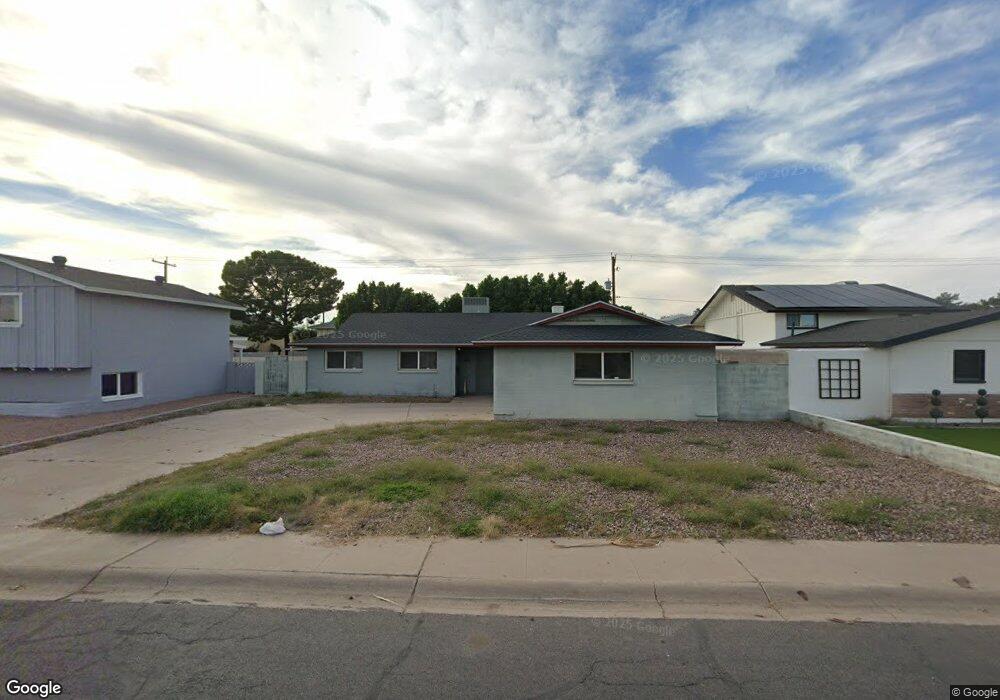
4622 S Grandview Ave Tempe, AZ 85282
The Lakes NeighborhoodEstimated Value: $408,252 - $520,000
3
Beds
2
Baths
1,814
Sq Ft
$264/Sq Ft
Est. Value
About This Home
This home is located at 4622 S Grandview Ave, Tempe, AZ 85282 and is currently estimated at $478,563, approximately $263 per square foot. 4622 S Grandview Ave is a home located in Maricopa County with nearby schools including Arredondo Elementary School, Connolly Middle School, and Tempe High School.
Ownership History
Date
Name
Owned For
Owner Type
Purchase Details
Closed on
Mar 13, 2008
Sold by
Mccurdy Beverley A
Bought by
Lindquist Benjamin G
Current Estimated Value
Home Financials for this Owner
Home Financials are based on the most recent Mortgage that was taken out on this home.
Original Mortgage
$200,970
Outstanding Balance
$124,595
Interest Rate
5.65%
Mortgage Type
FHA
Estimated Equity
$353,968
Purchase Details
Closed on
Jul 30, 2003
Sold by
Wagner Caryn L
Bought by
Mccurdy Beverley A
Home Financials for this Owner
Home Financials are based on the most recent Mortgage that was taken out on this home.
Original Mortgage
$117,750
Interest Rate
7.55%
Mortgage Type
Purchase Money Mortgage
Purchase Details
Closed on
Jan 16, 2001
Sold by
Wagner Caryn Louise and Estate Of Helen Louise Curtis
Bought by
Wagner Caryn Louise
Create a Home Valuation Report for This Property
The Home Valuation Report is an in-depth analysis detailing your home's value as well as a comparison with similar homes in the area
Home Values in the Area
Average Home Value in this Area
Purchase History
| Date | Buyer | Sale Price | Title Company |
|---|---|---|---|
| Lindquist Benjamin G | $206,000 | Security Title Agency Inc | |
| Mccurdy Beverley A | $158,000 | Security Title Agency | |
| Wagner Caryn Louise | -- | -- |
Source: Public Records
Mortgage History
| Date | Status | Borrower | Loan Amount |
|---|---|---|---|
| Open | Lindquist Benjamin G | $200,970 | |
| Previous Owner | Mccurdy Beverley A | $117,750 | |
| Closed | Mccurdy Beverley A | $15,800 |
Source: Public Records
Tax History Compared to Growth
Tax History
| Year | Tax Paid | Tax Assessment Tax Assessment Total Assessment is a certain percentage of the fair market value that is determined by local assessors to be the total taxable value of land and additions on the property. | Land | Improvement |
|---|---|---|---|---|
| 2025 | $2,112 | $20,263 | -- | -- |
| 2024 | $1,938 | $19,298 | -- | -- |
| 2023 | $1,938 | $36,620 | $7,320 | $29,300 |
| 2022 | $1,851 | $27,420 | $5,480 | $21,940 |
| 2021 | $1,887 | $25,470 | $5,090 | $20,380 |
| 2020 | $1,825 | $23,910 | $4,780 | $19,130 |
| 2019 | $1,790 | $22,250 | $4,450 | $17,800 |
| 2018 | $1,742 | $20,460 | $4,090 | $16,370 |
| 2017 | $1,687 | $18,650 | $3,730 | $14,920 |
| 2016 | $1,679 | $18,660 | $3,730 | $14,930 |
| 2015 | $1,624 | $16,370 | $3,270 | $13,100 |
Source: Public Records
Map
Nearby Homes
- 4629 S Mill Ave
- 4715 S Mill Ave Unit 129
- 400 W Baseline Rd Unit 29
- 400 W Baseline Rd Unit 281
- 400 W Baseline Rd Unit 219
- 400 W Baseline Rd Unit 202
- 400 W Baseline Rd Unit 69
- 400 W Baseline Rd Unit 34
- 400 W Baseline Rd Unit 124
- 400 W Baseline Rd Unit 318
- 400 W Baseline Rd Unit 100
- 400 W Baseline Rd Unit 95
- 400 W Baseline Rd Unit 244
- 400 W Baseline Rd Unit 179
- 506 E Ellis Dr
- 434 E Carson Dr
- 14 E Hermosa Dr Unit 47
- 315 W Riviera Dr
- 307 W Santa Cruz Dr
- 206 E Manhatton Dr
- 4700 S Grandview Ave
- 4616 S Grandview Ave
- 4637 S Mill Ave Unit 123
- 4641 S Mill Ave
- 4633 S Mill Ave Unit 122
- 4706 S Grandview Ave Unit 3
- 4610 S Grandview Ave
- 4625 S Mill Ave
- 4645 S Mill Ave Unit 125
- 4621 S Mill Ave Unit 115
- 4617 S Mill Ave
- 4707 S Mill Ave
- 4703 S Mill Ave
- 4623 S Grandview Ave
- 4617 S Grandview Ave
- 4711 S Mill Ave Unit 128
- 4712 S Grandview Ave Unit 3
- 4604 S Grandview Ave
- 4703 S Grandview Ave
- 4609 S Mill Ave Unit 118