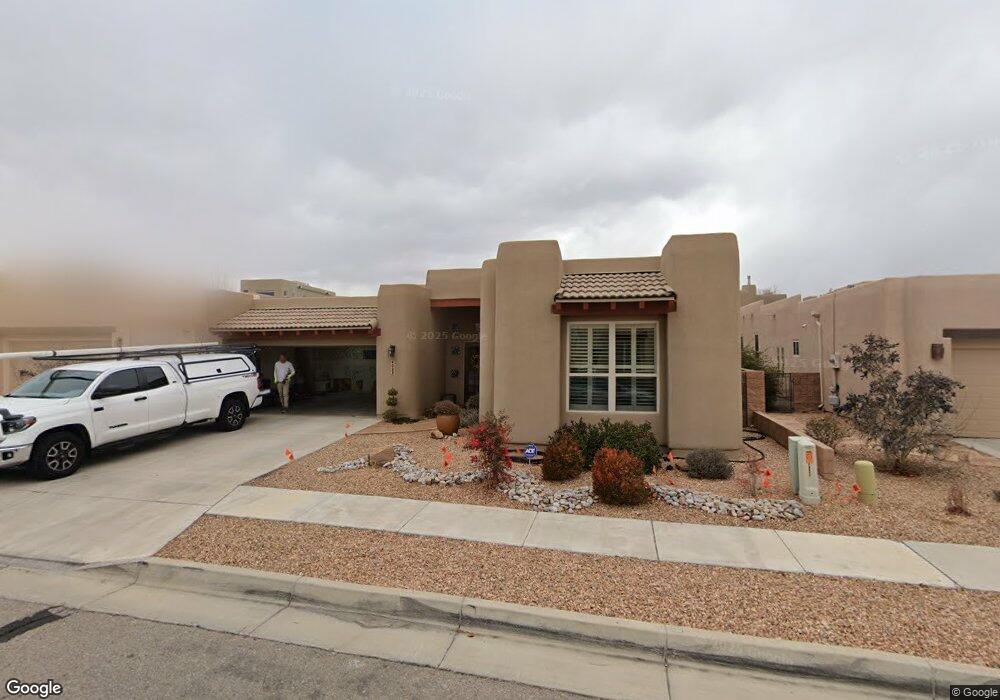
4623 Mi Cordelia Dr NW Albuquerque, NM 87120
Taylor Ranch NeighborhoodEstimated Value: $539,000 - $574,000
4
Beds
3
Baths
2,351
Sq Ft
$237/Sq Ft
Est. Value
About This Home
This home is located at 4623 Mi Cordelia Dr NW, Albuquerque, NM 87120 and is currently estimated at $556,862, approximately $236 per square foot. 4623 Mi Cordelia Dr NW is a home located in Bernalillo County with nearby schools including Susie R. Marmon Elementary School, John Adams Middle School, and West Mesa High School.
Ownership History
Date
Name
Owned For
Owner Type
Purchase Details
Closed on
Jan 26, 2007
Sold by
Baca Dorothy A
Bought by
Baca Ronald J and Baca Dorothy A
Current Estimated Value
Home Financials for this Owner
Home Financials are based on the most recent Mortgage that was taken out on this home.
Original Mortgage
$290,400
Outstanding Balance
$172,747
Interest Rate
1.25%
Mortgage Type
Negative Amortization
Estimated Equity
$384,115
Purchase Details
Closed on
Oct 17, 2006
Sold by
Andalucia Development Co Inc
Bought by
Bohlman Thomas
Home Financials for this Owner
Home Financials are based on the most recent Mortgage that was taken out on this home.
Original Mortgage
$75,171
Interest Rate
6.46%
Mortgage Type
Seller Take Back
Purchase Details
Closed on
Aug 1, 2006
Sold by
Andalucia Development Co Inc
Bought by
Sky View Homes Inc
Home Financials for this Owner
Home Financials are based on the most recent Mortgage that was taken out on this home.
Original Mortgage
$290,500
Interest Rate
6.66%
Mortgage Type
Construction
Create a Home Valuation Report for This Property
The Home Valuation Report is an in-depth analysis detailing your home's value as well as a comparison with similar homes in the area
Home Values in the Area
Average Home Value in this Area
Purchase History
| Date | Buyer | Sale Price | Title Company |
|---|---|---|---|
| Baca Ronald J | -- | Accommodation | |
| Baca Dorothy A | -- | Fidelity National Title Co | |
| Bohlman Thomas | -- | Fidelity National Title Co | |
| Sky View Homes Inc | -- | Fidelity National Title Co |
Source: Public Records
Mortgage History
| Date | Status | Borrower | Loan Amount |
|---|---|---|---|
| Open | Baca Dorothy A | $290,400 | |
| Previous Owner | Bohlman Thomas | $75,171 | |
| Previous Owner | Sky View Homes Inc | $290,500 |
Source: Public Records
Tax History Compared to Growth
Tax History
| Year | Tax Paid | Tax Assessment Tax Assessment Total Assessment is a certain percentage of the fair market value that is determined by local assessors to be the total taxable value of land and additions on the property. | Land | Improvement |
|---|---|---|---|---|
| 2025 | $5,479 | $133,745 | $50,748 | $82,997 |
| 2024 | $5,479 | $129,850 | $49,270 | $80,580 |
| 2023 | $5,387 | $126,070 | $47,836 | $78,234 |
| 2022 | $5,206 | $122,397 | $46,442 | $75,955 |
| 2021 | $5,031 | $118,833 | $45,090 | $73,743 |
| 2020 | $4,949 | $115,372 | $43,777 | $71,595 |
| 2019 | $4,803 | $112,012 | $42,502 | $69,510 |
| 2018 | $4,633 | $112,012 | $42,502 | $69,510 |
| 2017 | $4,490 | $108,750 | $41,264 | $67,486 |
| 2016 | $4,361 | $102,508 | $38,896 | $63,612 |
| 2015 | $99,522 | $99,522 | $37,763 | $61,759 |
| 2014 | $4,103 | $96,624 | $36,663 | $59,961 |
| 2013 | -- | $96,624 | $36,663 | $59,961 |
Source: Public Records
Map
Nearby Homes
- 4601 Mi Cordelia Dr NW
- 5304 Sacate Ave NW
- 4705 Mijas Dr NW
- 4616 Marbella Dr NW
- 4409 Summer Hill Ln NW
- 4844 Stafford Place NW
- 4928 Calle Espana NW
- 5108 Wild Plum Way NW
- 4316 Beresford Ln NW
- 5320 Old Adobe Trail NW
- 4301 Beresford Ln NW
- 3 Arco Ct NW
- 5012 Camino Valle Trail NW
- 5905 Los Riscos Rd NW
- 4800 Northern Trail NW
- 4110 Waterwillow Place NW
- 4208 Mesa Rincon Dr NW
- 4216 Mesa Rincon Dr NW
- 4901 Valle Rio Trail NW
- 5928 Las Cadenas Rd NW
- 4627 Mi Cordelia Dr NW
- 4619 Mi Cordelia Dr NW
- 4624 Monte Frio Dr NW
- 4628 Monte Frio Dr NW
- 4615 Mi Cordelia Dr NW
- 4620 Monte Frio Dr NW
- 4624 Mi Cordelia Dr NW
- 4632 Monte Frio Dr NW
- 4628 Mi Cordelia Dr NW
- 4620 Mi Cordelia Dr NW
- 4616 Monte Frio Dr NW
- 4632 Mi Cordelia Dr NW
- 4611 Mi Cordelia Dr NW
- 4636 Monte Frio Dr NW
- 4635 Mi Cordelia Dr NW
- 4616 Mi Cordelia Dr NW
- 4612 Monte Frio Dr NW
- 4636 Mi Cordelia Dr NW
- 4612 Mi Cordelia Dr NW
- 4609 Mi Cordelia Dr NW