R
Seller's Agent in 2020
Ryan Flannery
Ppmg of Texas
(901) 581-7824
118 Total Sales

Estimated Value: $222,536 - $259,000
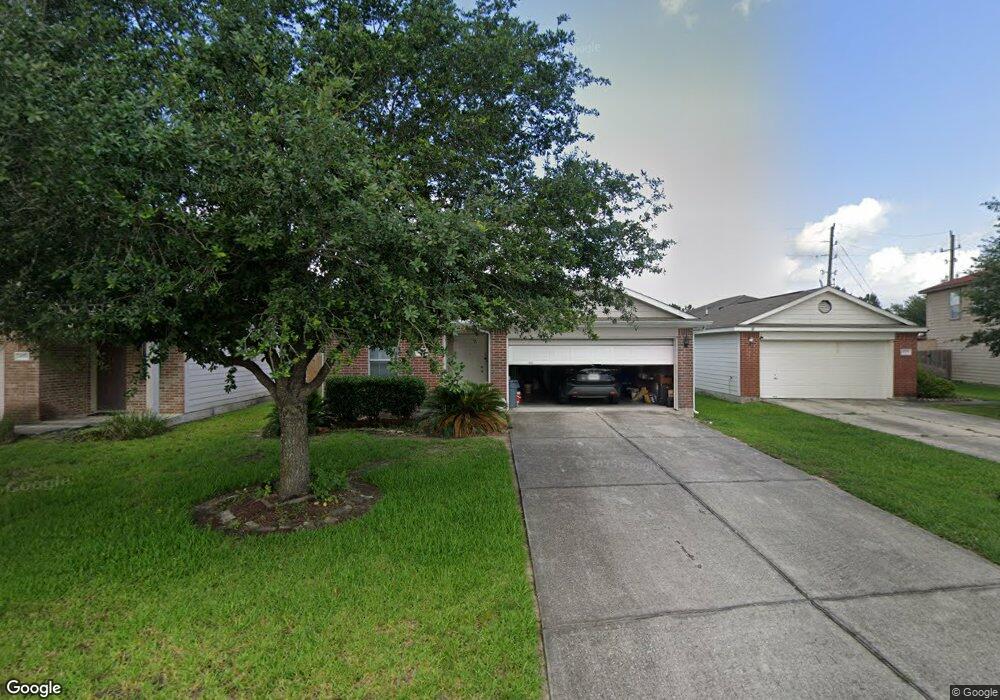
Beautiful one story completely renovated open floor plan home with gorgeous upgrades that includes fresh paint inside and out, updated landscaping, new blinds, new ceiling fans, new AC! New water heater, and all new plumbing fixtures. New Kitchen cabinets with brand new appliances. New vinyl plank throughout and new plush carpet in bedrooms! It is in the desirable community which has a Playground, Basketball court, walking trails, provides easy access to 99 and I-45 and is conveniently located near schools and amenities with several shopping and restaurant options in the area. Your new home is open and spacious with a large back yard.
Last Renter's Agent
Demetria Rutherford
Texas Ally Real Estate Group, LLC License #0461213

| Date | Buyer | Sale Price | Title Company |
|---|---|---|---|
| Dosanjh Jasbir | -- | Providence Title Company | |
| Rei Nation Llc | -- | None Available | |
| Giffen William B | -- | American Title Co |
| Date | Status | Borrower | Loan Amount |
|---|---|---|---|
| Open | Dosanjh Jasbir | $144,800 | |
| Previous Owner | Giffen William B | $130,021 |
| Date | Event | Price | List to Sale | Price per Sq Ft | Prior Sale |
|---|---|---|---|---|---|
| 07/22/2025 07/22/25 | Off Market | $1,600 | -- | -- | |
| 05/18/2025 05/18/25 | Off Market | -- | -- | -- | |
| 07/20/2020 07/20/20 | Rented | $1,600 | 0.0% | -- | |
| 06/27/2020 06/27/20 | For Rent | $1,600 | 0.0% | -- | |
| 06/27/2020 06/27/20 | Rented | $1,600 | 0.0% | -- | |
| 06/19/2020 06/19/20 | Sold | -- | -- | -- | View Prior Sale |
| 05/20/2020 05/20/20 | Pending | -- | -- | -- | |
| 05/08/2020 05/08/20 | For Sale | $185,000 | -- | $131 / Sq Ft |
| Year | Tax Paid | Tax Assessment Tax Assessment Total Assessment is a certain percentage of the fair market value that is determined by local assessors to be the total taxable value of land and additions on the property. | Land | Improvement |
|---|---|---|---|---|
| 2025 | $3,924 | $245,000 | $31,447 | $213,553 |
| 2024 | $3,869 | $248,435 | $31,447 | $216,988 |
| 2023 | $3,869 | $245,530 | $31,450 | $214,080 |
| 2022 | $3,862 | $222,560 | $31,450 | $191,110 |
| 2021 | $3,218 | $174,080 | $31,450 | $142,630 |
| 2020 | $2,799 | $143,980 | $31,450 | $129,600 |
| 2019 | $2,637 | $130,890 | $31,450 | $124,850 |
| 2018 | $1,934 | $118,990 | $31,450 | $112,830 |
| 2017 | $2,176 | $108,170 | $31,450 | $112,830 |
| 2016 | $1,978 | $98,340 | $31,450 | $101,740 |
| 2015 | $1,449 | $89,400 | $31,450 | $100,070 |
| 2014 | $1,449 | $81,270 | $31,450 | $77,410 |
R
Seller's Agent in 2020
Ryan Flannery
Ppmg of Texas
(901) 581-7824
118 Total Sales
Landlord's Agent in 2020
Pia Johal
PRG, Realtors
(832) 851-9190
31 Total Sales
D
Tenant's Agent in 2020
Demetria Rutherford
Texas Ally Real Estate Group, LLC
Source: Houston Association of REALTORS®
MLS Number: 23391586
APN: 3527-03-01300
Disclaimer: Certain information contained herein is derived from information provided by parties other than Homes.com. All information provided is deemed reliable, but is not guaranteed to be accurate and should be independently verified.
![]() Copyright 2026, Houston REALTORS® Information Service, Inc.
Copyright 2026, Houston REALTORS® Information Service, Inc.
The information provided is exclusively for consumers’ personal, non-commercial use, and may not be used for any purpose other than to identify prospective properties consumers may be interested in purchasing.
Information is deemed reliable but not guaranteed.
Ask me questions while you tour the home.