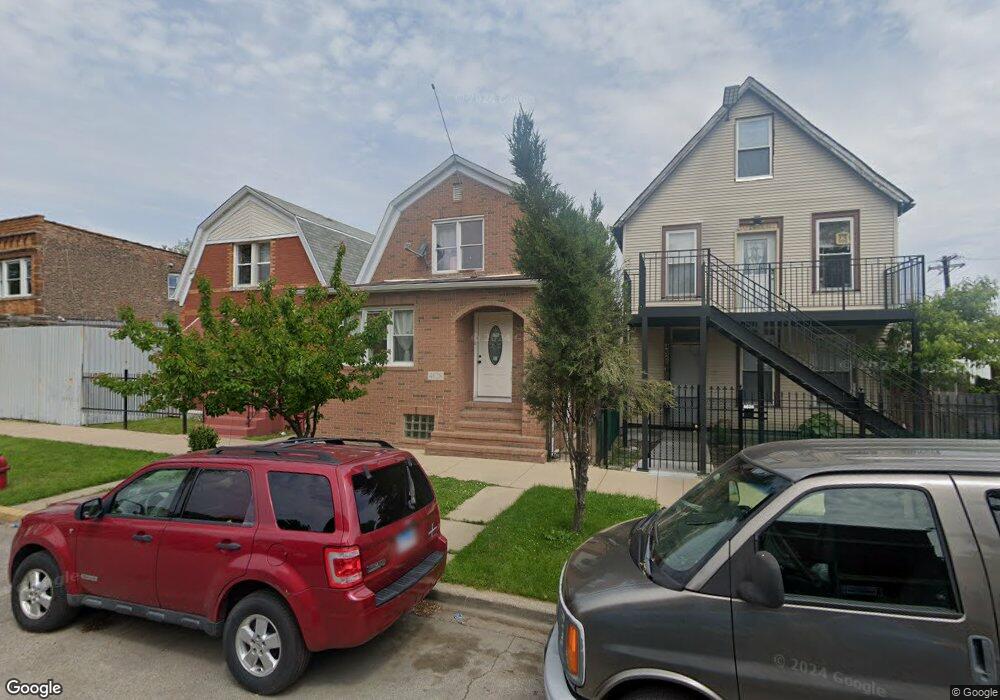
4628 W Huron St Chicago, IL 60644
West Humboldt Park NeighborhoodEstimated Value: $212,000 - $306,000
3
Beds
2
Baths
1,408
Sq Ft
$192/Sq Ft
Est. Value
About This Home
This home is located at 4628 W Huron St, Chicago, IL 60644 and is currently estimated at $270,849, approximately $192 per square foot. 4628 W Huron St is a home located in Cook County with nearby schools including Nash Elementary School, Marshall Metropolitan High School, and KIPP One Academy.
Ownership History
Date
Name
Owned For
Owner Type
Purchase Details
Closed on
Nov 9, 2017
Sold by
Inr Corp
Bought by
Betancourt Santiago and Munoz Rafaela
Current Estimated Value
Purchase Details
Closed on
May 6, 2010
Sold by
Rodriguez Ismael
Bought by
Inr Corporation
Purchase Details
Closed on
Dec 16, 2009
Sold by
Rodriguez Bernadino
Bought by
Inr Corporation
Purchase Details
Closed on
Oct 31, 2003
Sold by
Okulaja Abiodun and Okulaja Rose
Bought by
Rodriguez Bernardino
Purchase Details
Closed on
Jan 16, 1998
Sold by
Leonard Bernard M and Edelstein Michael L
Bought by
Okulaja Abiodun and Okulaja Rose
Home Financials for this Owner
Home Financials are based on the most recent Mortgage that was taken out on this home.
Original Mortgage
$72,950
Interest Rate
7.24%
Mortgage Type
FHA
Purchase Details
Closed on
Sep 30, 1997
Sold by
Techen Elmer F and Techen Jean
Bought by
Leonard Bernard M and Edelstein Michael L
Create a Home Valuation Report for This Property
The Home Valuation Report is an in-depth analysis detailing your home's value as well as a comparison with similar homes in the area
Home Values in the Area
Average Home Value in this Area
Purchase History
| Date | Buyer | Sale Price | Title Company |
|---|---|---|---|
| Betancourt Santiago | $159,500 | Greater Illinois Title | |
| Inr Corporation | -- | None Available | |
| Inr Corporation | -- | None Available | |
| Rodriguez Bernardino | $75,000 | Pntn | |
| Okulaja Abiodun | $73,000 | -- | |
| Leonard Bernard M | $19,000 | -- |
Source: Public Records
Mortgage History
| Date | Status | Borrower | Loan Amount |
|---|---|---|---|
| Previous Owner | Okulaja Abiodun | $72,950 |
Source: Public Records
Tax History
| Year | Tax Paid | Tax Assessment Tax Assessment Total Assessment is a certain percentage of the fair market value that is determined by local assessors to be the total taxable value of land and additions on the property. | Land | Improvement |
|---|---|---|---|---|
| 2025 | $1,688 | $17,100 | $4,386 | $12,714 |
| 2024 | $1,688 | $17,100 | $4,386 | $12,714 |
| 2023 | $1,645 | $8,000 | $3,554 | $4,446 |
| 2022 | $1,645 | $8,000 | $3,554 | $4,446 |
| 2021 | $1,609 | $7,999 | $3,554 | $4,445 |
| 2020 | $2,780 | $12,480 | $3,554 | $8,926 |
| 2019 | $2,786 | $13,867 | $3,554 | $10,313 |
| 2018 | $2,739 | $13,867 | $3,554 | $10,313 |
| 2017 | $1,427 | $10,006 | $3,176 | $6,830 |
| 2016 | $1,504 | $10,006 | $3,176 | $6,830 |
| 2015 | $1,353 | $10,006 | $3,176 | $6,830 |
| 2014 | $1,300 | $9,573 | $3,025 | $6,548 |
| 2013 | $1,263 | $9,573 | $3,025 | $6,548 |
Source: Public Records
Map
Nearby Homes
- 4711 W Huron St
- 4745 W Ohio St
- 917 N Cicero Ave
- 4832 W Ferdinand St
- 4838 W Iowa St
- 5404 W Walton St
- 4850 W Iowa St
- 4433 W Walton St
- 4954 W Huron St
- 4914 W Ferdinand St
- 4923 W Iowa St
- 4630 W Erie St
- 4939 W Race Ave
- 4941 W Iowa St
- 4949 W Iowa St
- 4918 W Hubbard St
- 257 N Kilbourn Ave
- 5027 W Huron St
- 4855 W Cortez St
- 5040 W Ohio St
- 4628 W Huron St
- 4632 W Huron St
- 4626 W Huron St
- 4620 W Huron St
- 4636 W Huron St
- 4636 W Huron St
- 4616 W Huron St
- 4633 W Superior St
- 4614 W Huron St
- 4637 W Superior St
- 4639 W Superior St
- 4643 W Superior St
- 4625 W Huron St
- 4637 W Huron St
- 4645 W Superior St
- 4649 W Superior St
- 4652 W Huron St
- 4651 W Superior St
- 4651 W Superior St
- 4609 W Huron St
Your Personal Tour Guide
Ask me questions while you tour the home.