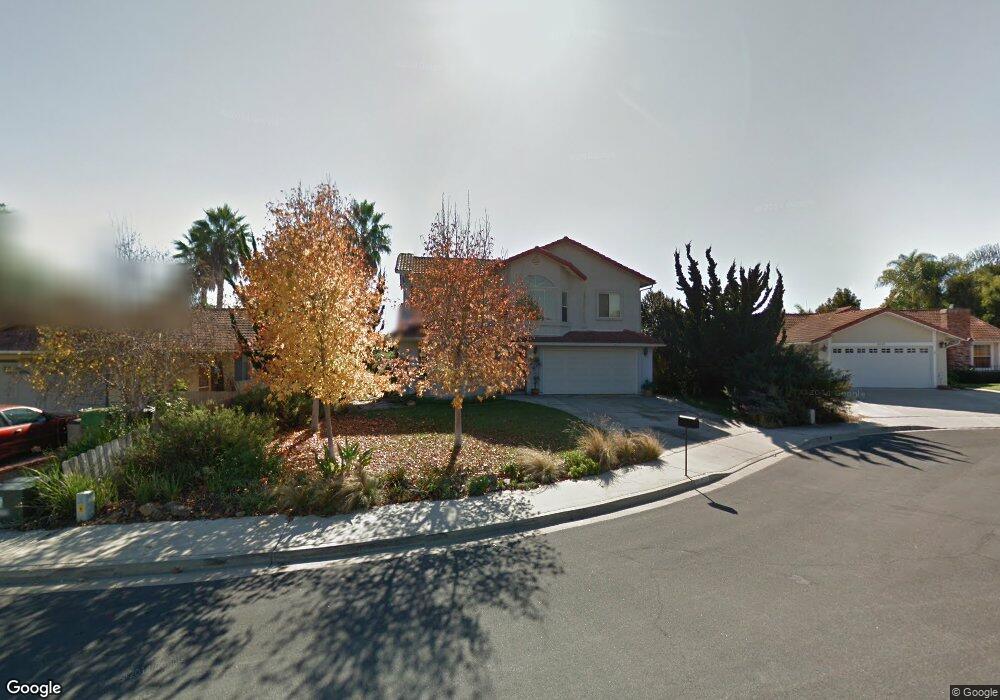
4629 Windfall Terrace Oceanside, CA 92056
Peacock NeighborhoodEstimated Value: $953,000 - $1,064,000
4
Beds
3
Baths
2,316
Sq Ft
$438/Sq Ft
Est. Value
About This Home
This home is located at 4629 Windfall Terrace, Oceanside, CA 92056 and is currently estimated at $1,015,387, approximately $438 per square foot. 4629 Windfall Terrace is a home located in San Diego County with nearby schools including Empresa Elementary School, Roosevelt Middle School, and Vista High School.
Ownership History
Date
Name
Owned For
Owner Type
Purchase Details
Closed on
Mar 6, 2008
Sold by
Atkinson Randy
Bought by
Atkinson Randy
Current Estimated Value
Home Financials for this Owner
Home Financials are based on the most recent Mortgage that was taken out on this home.
Original Mortgage
$292,700
Interest Rate
5.65%
Mortgage Type
Stand Alone Refi Refinance Of Original Loan
Purchase Details
Closed on
Dec 9, 2002
Sold by
Atkinson Lauri
Bought by
Atkinson Randy
Home Financials for this Owner
Home Financials are based on the most recent Mortgage that was taken out on this home.
Original Mortgage
$262,050
Interest Rate
6.03%
Purchase Details
Closed on
Apr 27, 1999
Sold by
Wayne Stark R and Wayne Margaret A
Bought by
Atkinson Randy and Atkinson Lauri
Home Financials for this Owner
Home Financials are based on the most recent Mortgage that was taken out on this home.
Original Mortgage
$150,000
Interest Rate
6.84%
Purchase Details
Closed on
Mar 19, 1992
Purchase Details
Closed on
Nov 15, 1984
Create a Home Valuation Report for This Property
The Home Valuation Report is an in-depth analysis detailing your home's value as well as a comparison with similar homes in the area
Home Values in the Area
Average Home Value in this Area
Purchase History
| Date | Buyer | Sale Price | Title Company |
|---|---|---|---|
| Atkinson Randy | -- | Chicago Title Company | |
| Atkinson Randy | -- | Lawyers Title Company | |
| Atkinson Randy | -- | Fidelity National Title Co | |
| -- | $149,900 | -- | |
| -- | $90,400 | -- |
Source: Public Records
Mortgage History
| Date | Status | Borrower | Loan Amount |
|---|---|---|---|
| Closed | Atkinson Randy | $292,700 | |
| Closed | Atkinson Randy | $262,050 | |
| Closed | Atkinson Randy | $150,000 |
Source: Public Records
Tax History
| Year | Tax Paid | Tax Assessment Tax Assessment Total Assessment is a certain percentage of the fair market value that is determined by local assessors to be the total taxable value of land and additions on the property. | Land | Improvement |
|---|---|---|---|---|
| 2025 | $3,979 | $375,997 | $111,406 | $264,591 |
| 2024 | $3,979 | $368,625 | $109,222 | $259,403 |
| 2023 | $3,882 | $361,398 | $107,081 | $254,317 |
| 2022 | $3,871 | $354,313 | $104,982 | $249,331 |
| 2021 | $3,783 | $347,367 | $102,924 | $244,443 |
| 2020 | $3,770 | $343,806 | $101,869 | $241,937 |
| 2019 | $3,713 | $337,066 | $99,872 | $237,194 |
| 2018 | $3,529 | $330,458 | $97,914 | $232,544 |
| 2017 | $70 | $323,980 | $95,995 | $227,985 |
| 2016 | $3,378 | $317,628 | $94,113 | $223,515 |
| 2015 | $3,364 | $312,858 | $92,700 | $220,158 |
| 2014 | $3,280 | $306,731 | $90,885 | $215,846 |
Source: Public Records
Map
Nearby Homes
- 1423 Mountain Meadow Dr
- 1413 Panorama Ridge Rd
- 4699 Mystik Rd
- 4719 Mystik Rd
- 1574 Boulder Creek Rd
- 1540 Highridge Dr
- 4734 Rim Rock Rd
- 1424 Calle Marbella
- 1521 Temple Heights Dr
- 1523 Temple Heights Dr
- 4538 Sunrise Ridge
- 1702 Havenwood Dr Unit 1702
- 1560 Via Botero
- 4558 Golden Ridge Dr
- 1400 Darwin Dr
- 475 Taylor Dr
- 1351 Cottonwood Dr
- 1593 Avenida Guillermo
- 4530 Beverly Glen Dr
- 1376 Darwin Dr
- 4633 Windfall Terrace
- 4625 Windfall Terrace
- 1419 Mountain Meadow Dr
- 1415 Mountain Meadow Dr
- 4628 Windfall Terrace
- 4621 Windfall Terrace
- 1427 Mountain Meadow Dr
- 4632 Windfall Terrace
- 4624 Windfall Terrace
- 1470 Broken Hitch Rd
- 1466 Broken Hitch Rd
- 1474 Broken Hitch Rd
- 1462 Broken Hitch Rd
- 4620 Windfall Terrace
- 1431 Mountain Meadow Dr
- 1420 Mountain Meadow Dr
- 1416 Mountain Meadow Dr
- 1458 Broken Hitch Rd
- 1482 Broken Hitch Rd
- 4637 Cedar Ridge Place
Your Personal Tour Guide
Ask me questions while you tour the home.