Estimated Value: $578,272 - $657,000
3
Beds
2
Baths
1,373
Sq Ft
$445/Sq Ft
Est. Value
About This Home
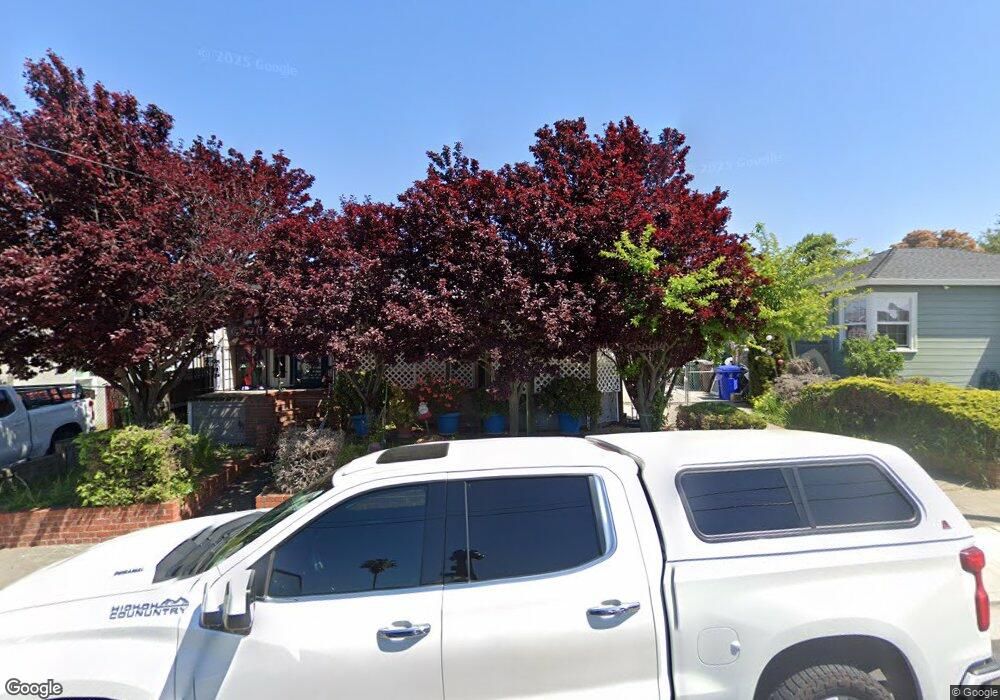
This home is located at 463 Suisun Ave, Rodeo, CA 94572 and is currently estimated at $610,318, approximately $444 per square foot. 463 Suisun Ave is a home located in Contra Costa County with nearby schools including Rodeo Hills Elementary School, Carquinez Middle School, and John Swett High School.
Ownership History
Date
Name
Owned For
Owner Type
Purchase Details
Closed on
Jun 13, 2012
Sold by
Sutton Jeffrey David and Wallin Sutton Gretchen
Bought by
Lopez Maria Del Refugio
Current Estimated Value
Home Financials for this Owner
Home Financials are based on the most recent Mortgage that was taken out on this home.
Original Mortgage
$211,105
Outstanding Balance
$146,028
Interest Rate
3.79%
Mortgage Type
FHA
Estimated Equity
$464,290
Purchase Details
Closed on
Sep 2, 1999
Sold by
Le Beuf Rosamond Y and Le Gail Carol
Bought by
Sutton Jeffery David and Wallin Sutton Gretchen
Home Financials for this Owner
Home Financials are based on the most recent Mortgage that was taken out on this home.
Original Mortgage
$185,028
Interest Rate
7.66%
Mortgage Type
VA
Purchase Details
Closed on
Mar 3, 1999
Sold by
Le Beuf Rosamond Y
Bought by
Lebeuf Rosamond Y and Walker Carol D
Create a Home Valuation Report for This Property
The Home Valuation Report is an in-depth analysis detailing your home's value as well as a comparison with similar homes in the area
Home Values in the Area
Average Home Value in this Area
Purchase History
| Date | Buyer | Sale Price | Title Company |
|---|---|---|---|
| Lopez Maria Del Refugio | $215,000 | Old Republic Title Company | |
| Sutton Jeffery David | $181,500 | North American Title Co | |
| Lebeuf Rosamond Y | -- | -- |
Source: Public Records
Mortgage History
| Date | Status | Borrower | Loan Amount |
|---|---|---|---|
| Open | Lopez Maria Del Refugio | $211,105 | |
| Previous Owner | Sutton Jeffery David | $185,028 |
Source: Public Records
Tax History
| Year | Tax Paid | Tax Assessment Tax Assessment Total Assessment is a certain percentage of the fair market value that is determined by local assessors to be the total taxable value of land and additions on the property. | Land | Improvement |
|---|---|---|---|---|
| 2025 | $4,896 | $270,036 | $113,037 | $156,999 |
| 2024 | $4,749 | $264,742 | $110,821 | $153,921 |
| 2023 | $4,675 | $259,552 | $108,649 | $150,903 |
| 2022 | $4,540 | $254,464 | $106,519 | $147,945 |
| 2021 | $4,462 | $249,476 | $104,431 | $145,045 |
| 2019 | $4,355 | $242,079 | $101,335 | $140,744 |
| 2018 | $4,247 | $237,334 | $99,349 | $137,985 |
| 2017 | $4,173 | $232,681 | $97,401 | $135,280 |
| 2016 | $3,834 | $228,120 | $95,492 | $132,628 |
| 2015 | $3,804 | $224,694 | $94,058 | $130,636 |
| 2014 | $3,745 | $220,294 | $92,216 | $128,078 |
Source: Public Records
Map
Nearby Homes
- 1334 7th St
- 343 Rodeo Ave
- 11 Fallen Leaf Ct
- 511 Third St
- 715 Mariposa Ave
- 205 Pacific Ave Unit 213
- 729 1st St
- 229 Lake Ave
- 139 Rodeo Ave
- 836 Hawthorne Dr
- 338 Garretson Ave
- 106 White Cap Cove
- 1012 Salt Spray Terrace
- 900 Seascape Cir
- 797 Coral Ridge Cir
- 1101 Chelsea
- 120 Bonita Ct
- 801 Dover
- 802 Dover
- 704 Windsor Unit 704
- 461 Suisun Ave
- 465 Suisun Ave
- 444 Vallejo Ave
- 467 Suisun Ave
- 459 Suisun Ave
- 450 Vallejo Ave
- 438 Vallejo Ave
- 456 Vallejo Ave
- 432 Vallejo Ave
- 462 Suisun Ave
- 457 Suisun Ave
- 466 Suisun Ave
- 1108 Mahoney St
- 458 Suisun Ave
- 460 Vallejo Ave
- 426 Vallejo Ave
- 470 Suisun Ave
- 456 Suisun Ave
- 411 Suisun Ave
- 420 Vallejo Ave
Your Personal Tour Guide
Ask me questions while you tour the home.