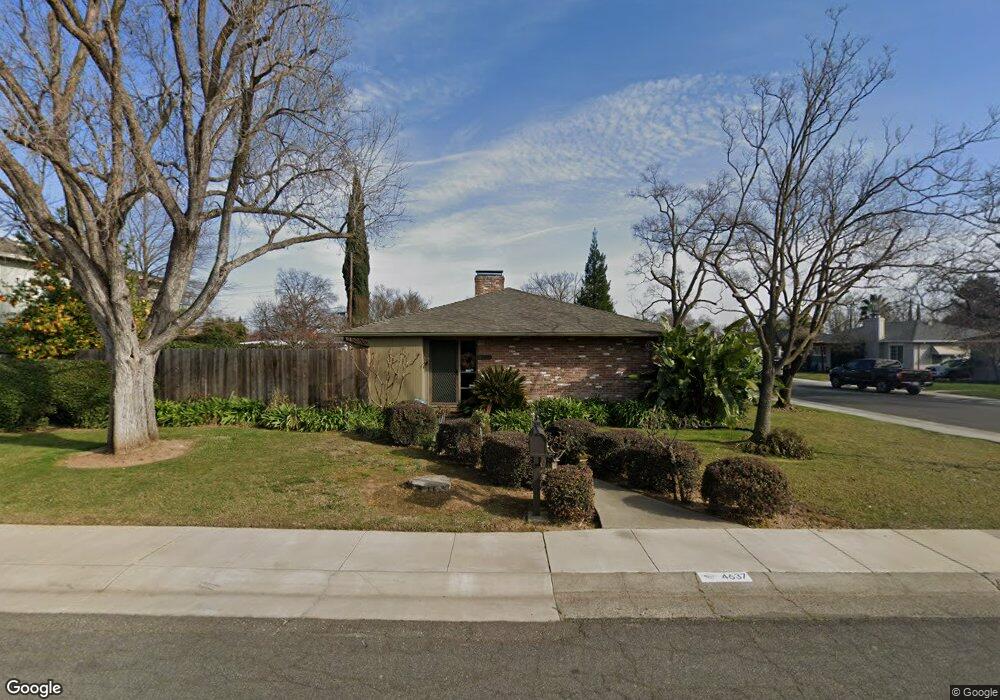
4637 Fegan Way Sacramento, CA 95822
Hollywood Park NeighborhoodEstimated Value: $453,000 - $595,000
2
Beds
1
Bath
1,460
Sq Ft
$379/Sq Ft
Est. Value
About This Home
This home is located at 4637 Fegan Way, Sacramento, CA 95822 and is currently estimated at $553,781, approximately $379 per square foot. 4637 Fegan Way is a home located in Sacramento County with nearby schools including Hollywood Park Elementary School, California Middle, and C. K. McClatchy High.
Ownership History
Date
Name
Owned For
Owner Type
Purchase Details
Closed on
Oct 27, 2020
Sold by
Irwin Diloreto Julie Rae and Irwin Diloreto Julie
Bought by
Irwin Diloreto Julie Rae and Julie Irwin Diloreto Living Tr
Current Estimated Value
Home Financials for this Owner
Home Financials are based on the most recent Mortgage that was taken out on this home.
Original Mortgage
$184,650
Interest Rate
2.67%
Mortgage Type
New Conventional
Purchase Details
Closed on
Oct 17, 2019
Sold by
Irwin Diloreto Julie Rae
Bought by
Irwin Diloreto Julie and The Julie Irwin Diloreto Livin
Purchase Details
Closed on
Dec 14, 2001
Sold by
Diloreto Peter C
Bought by
Irwin Diloreto Julie Rae
Home Financials for this Owner
Home Financials are based on the most recent Mortgage that was taken out on this home.
Original Mortgage
$124,500
Interest Rate
6.84%
Create a Home Valuation Report for This Property
The Home Valuation Report is an in-depth analysis detailing your home's value as well as a comparison with similar homes in the area
Home Values in the Area
Average Home Value in this Area
Purchase History
| Date | Buyer | Sale Price | Title Company |
|---|---|---|---|
| Irwin Diloreto Julie Rae | -- | Amrock Llc | |
| Irwin Diloreto Julie Rae | -- | Amrock Llc | |
| Irwin Diloreto Julie | -- | None Available | |
| Irwin Diloreto Julie Rae | -- | Alliance Title Company |
Source: Public Records
Mortgage History
| Date | Status | Borrower | Loan Amount |
|---|---|---|---|
| Closed | Irwin Diloreto Julie Rae | $184,650 | |
| Closed | Irwin Diloreto Julie Rae | $124,500 |
Source: Public Records
Tax History Compared to Growth
Tax History
| Year | Tax Paid | Tax Assessment Tax Assessment Total Assessment is a certain percentage of the fair market value that is determined by local assessors to be the total taxable value of land and additions on the property. | Land | Improvement |
|---|---|---|---|---|
| 2025 | $2,264 | $171,915 | $41,409 | $130,506 |
| 2024 | $2,264 | $168,546 | $40,598 | $127,948 |
| 2023 | $2,212 | $165,242 | $39,802 | $125,440 |
| 2022 | $2,175 | $162,003 | $39,022 | $122,981 |
| 2021 | $2,000 | $158,827 | $38,257 | $120,570 |
| 2020 | $2,010 | $157,199 | $37,865 | $119,334 |
| 2019 | $1,968 | $154,118 | $37,123 | $116,995 |
| 2018 | $1,917 | $151,097 | $36,396 | $114,701 |
| 2017 | $1,889 | $148,135 | $35,683 | $112,452 |
| 2016 | $1,793 | $145,232 | $34,984 | $110,248 |
| 2015 | $1,765 | $143,051 | $34,459 | $108,592 |
| 2014 | $1,720 | $140,249 | $33,784 | $106,465 |
Source: Public Records
Map
Nearby Homes
- 2161 Stacia Way
- 4989 Virginia Way
- 4681 Larson Way
- 2091 16th Ave
- 2225 Irvin Way
- 2065 15th Ave
- 4913 23rd St
- 2123 15th Ave
- 1810 Opper Ave
- 2333 22nd Ave
- 2204 15th Ave
- 2117 Fruitridge Rd
- 2370 19th Ave
- 4400 Capri Way
- 5531 Michael Way
- 2355 Hooke Way
- 1621 Fruitridge Rd
- 5609 Norman Way
- 5604 Johns Dr
- 4851 Alta Dr