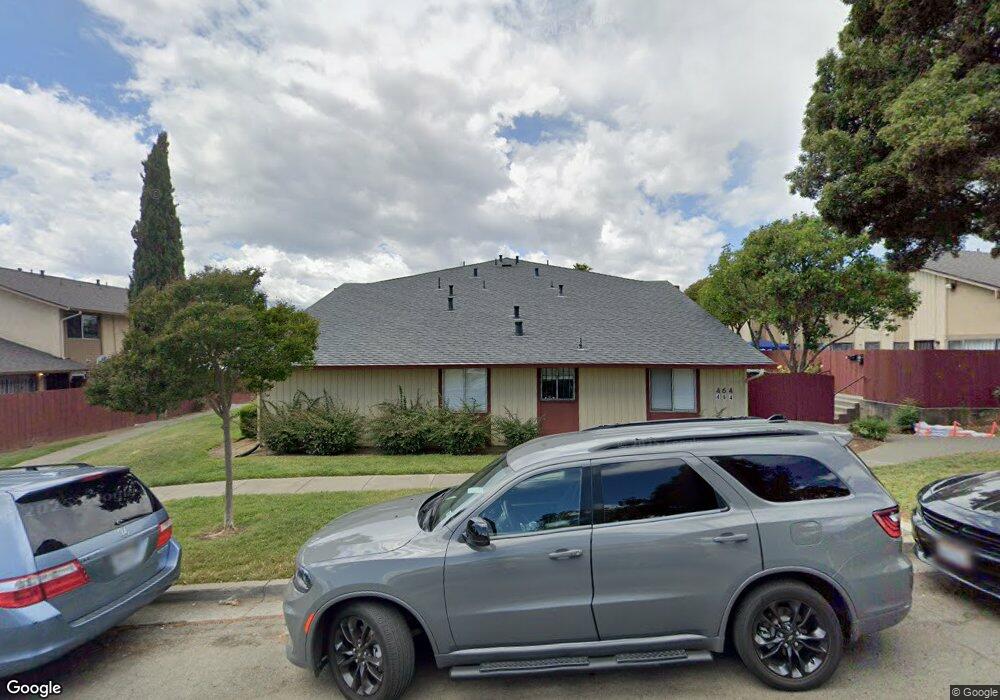
464 Corcoran Ave Unit 3 Vallejo, CA 94589
North Vallejo NeighborhoodEstimated Value: $215,000 - $247,880
2
Beds
2
Baths
1,032
Sq Ft
$230/Sq Ft
Est. Value
About This Home
This home is located at 464 Corcoran Ave Unit 3, Vallejo, CA 94589 and is currently estimated at $236,970, approximately $229 per square foot. 464 Corcoran Ave Unit 3 is a home located in Solano County with nearby schools including Elsa Widenmann Elementary, Solano Middle School, and Vallejo High School.
Ownership History
Date
Name
Owned For
Owner Type
Purchase Details
Closed on
Aug 9, 2013
Sold by
Casa Del Monte Homeowners Association
Bought by
Calugay Lope M and Calugay Bernadette M
Current Estimated Value
Purchase Details
Closed on
Aug 5, 2013
Sold by
Calugay Lope M and Calugay Bernadette C
Bought by
Hernandez Miguel
Purchase Details
Closed on
Apr 8, 2013
Sold by
Calugay Lope M and Calugay Bernadette
Bought by
Casa Del Monte Homeowners Association
Purchase Details
Closed on
Nov 5, 2006
Sold by
Calugay Lope and Calugay Bernadette
Bought by
Calugay Lope M and Calugay Bernadette C
Purchase Details
Closed on
Mar 23, 2002
Sold by
Pingol Julie and Tango Julie P
Bought by
Calugay Lope M and Calugay Bernadette C
Purchase Details
Closed on
Apr 4, 1997
Sold by
U S Bank Of California
Bought by
Tango Julie P
Purchase Details
Closed on
Jul 3, 1996
Sold by
Dhawan Charan and Dhawan Kiran
Bought by
Alameda First National Bank
Create a Home Valuation Report for This Property
The Home Valuation Report is an in-depth analysis detailing your home's value as well as a comparison with similar homes in the area
Home Values in the Area
Average Home Value in this Area
Purchase History
| Date | Buyer | Sale Price | Title Company |
|---|---|---|---|
| Calugay Lope M | -- | First American Title Company | |
| Hernandez Miguel | $44,500 | First American Title Company | |
| Casa Del Monte Homeowners Association | $13,242 | First American Title Company | |
| Calugay Lope M | -- | None Available | |
| Calugay Lope M | -- | -- | |
| Tango Julie P | $20,000 | First American Title Guarant | |
| Alameda First National Bank | $35,000 | North American Title Co |
Source: Public Records
Tax History
| Year | Tax Paid | Tax Assessment Tax Assessment Total Assessment is a certain percentage of the fair market value that is determined by local assessors to be the total taxable value of land and additions on the property. | Land | Improvement |
|---|---|---|---|---|
| 2025 | $2,124 | $91,926 | $14,704 | $77,222 |
| 2024 | $2,124 | $90,124 | $14,416 | $75,708 |
| 2023 | $1,961 | $88,358 | $14,134 | $74,224 |
| 2022 | $1,838 | $86,626 | $13,857 | $72,769 |
| 2021 | $1,795 | $84,929 | $13,586 | $71,343 |
| 2020 | $1,778 | $84,059 | $13,447 | $70,612 |
| 2019 | $1,700 | $82,412 | $13,184 | $69,228 |
| 2018 | $1,574 | $80,797 | $12,926 | $67,871 |
| 2017 | $1,479 | $79,214 | $12,673 | $66,541 |
| 2016 | $919 | $77,662 | $12,425 | $65,237 |
| 2015 | $907 | $76,497 | $12,239 | $64,258 |
| 2014 | $895 | $75,000 | $12,000 | $63,000 |
Source: Public Records
Map
Nearby Homes
- 151 Marquette Ave
- 141 Dartmouth Ave
- 102 Dartmouth Ave
- 203 Baylor Dr Unit 11
- 818 Falcon Dr
- 106 Fieldstone Way
- 300 College Ave
- 475 Whitney Ave
- 121 Forsythia Ct
- 121 Notre Dame Ct
- 240 Rinaldo Dr
- 35 Marla Dr
- 408 Lakeside Dr
- 147 Erin Dr
- 2555 Flosden Rd Unit 117
- 2555 Flosden Rd Unit 65
- 19 Kevin Ln
- 316 Meadows Dr
- 1815 Mini Dr
- 130 Kennison Ct
- 464 Corcoran Ave Unit 2
- 464 Corcoran Ave Unit 4
- 464 Corcoran Ave Unit 57
- 464 Corcoran Ave Unit 55
- 464 Corcoran Ave Unit 5
- 464 Corcoran Ave
- 472 Corcoran Ave Unit 3
- 472 Corcoran Ave Unit 2
- 472 Corcoran Ave Unit 1
- 472 Corcoran Ave
- 472 Corcoran Ave Unit 59
- 472 Corcoran Ave
- 460 Corcoran Ave Unit 2
- 460 Corcoran Ave Unit 3
- 460 Corcoran Ave Unit 50
- 460 Corcoran Ave
- 460 Corcoran Ave Unit 5
- 460 Corcoran Ave Unit 4
- 468 Corcoran Ave Unit 2
Your Personal Tour Guide
Ask me questions while you tour the home.