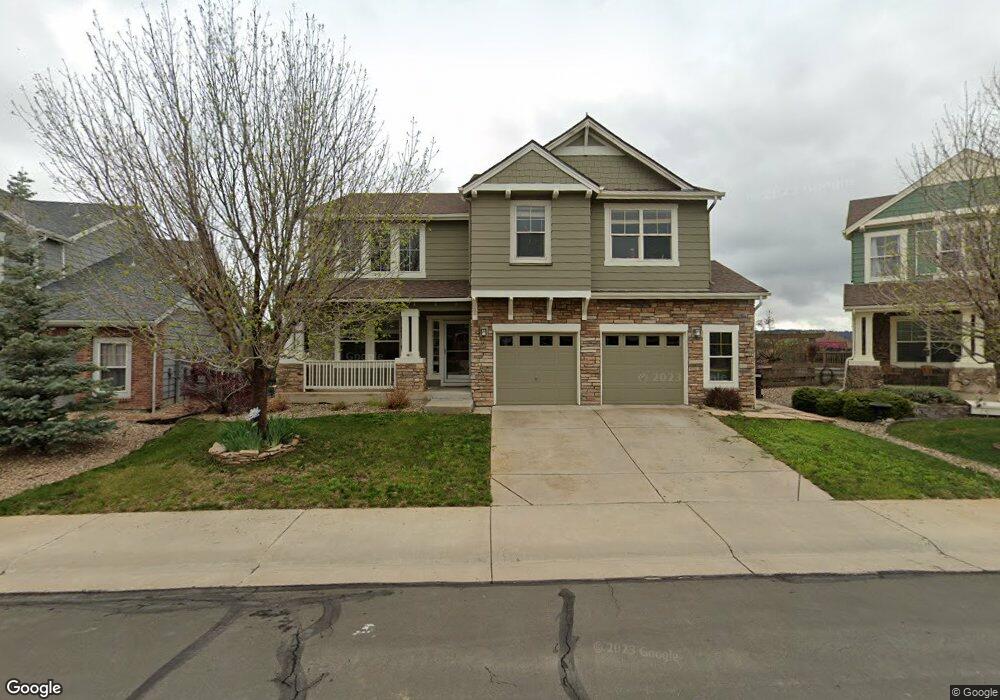
4647 Charing Ct Castle Rock, CO 80109
The Meadows NeighborhoodEstimated Value: $638,000 - $723,000
4
Beds
3
Baths
3,416
Sq Ft
$202/Sq Ft
Est. Value
About This Home
This home is located at 4647 Charing Ct, Castle Rock, CO 80109 and is currently estimated at $691,695, approximately $202 per square foot. 4647 Charing Ct is a home located in Douglas County with nearby schools including Meadow View Elementary School, Castle Rock Middle School, and Castle View High School.
Ownership History
Date
Name
Owned For
Owner Type
Purchase Details
Closed on
Sep 13, 2016
Sold by
Hp Colorado I Llc
Bought by
Hpa Borrower 2016 & 2 Llc
Current Estimated Value
Home Financials for this Owner
Home Financials are based on the most recent Mortgage that was taken out on this home.
Original Mortgage
$342,610,385
Outstanding Balance
$273,839,781
Interest Rate
3.45%
Mortgage Type
Commercial
Estimated Equity
-$273,148,086
Purchase Details
Closed on
Apr 28, 2016
Sold by
Spar Stephen A and Spar Carol A
Bought by
Hp Colorado I Llc
Purchase Details
Closed on
Jul 14, 2000
Sold by
Engle Home Colorado Inc
Bought by
Spar Stephen A and Spar Carol A
Home Financials for this Owner
Home Financials are based on the most recent Mortgage that was taken out on this home.
Original Mortgage
$200,500
Interest Rate
8.56%
Purchase Details
Closed on
Dec 17, 1998
Sold by
Castle Rock Development Company
Bought by
Engle Homes Colorado Inc
Create a Home Valuation Report for This Property
The Home Valuation Report is an in-depth analysis detailing your home's value as well as a comparison with similar homes in the area
Home Values in the Area
Average Home Value in this Area
Purchase History
| Date | Buyer | Sale Price | Title Company |
|---|---|---|---|
| Hpa Borrower 2016 & 2 Llc | -- | None Available | |
| Hp Colorado I Llc | $427,500 | Stewart Title | |
| Spar Stephen A | $250,700 | Universal Land Title | |
| Engle Homes Colorado Inc | $2,830,800 | -- |
Source: Public Records
Mortgage History
| Date | Status | Borrower | Loan Amount |
|---|---|---|---|
| Open | Hpa Borrower 2016 & 2 Llc | $342,610,385 | |
| Previous Owner | Spar Stephen A | $200,500 |
Source: Public Records
Tax History Compared to Growth
Tax History
| Year | Tax Paid | Tax Assessment Tax Assessment Total Assessment is a certain percentage of the fair market value that is determined by local assessors to be the total taxable value of land and additions on the property. | Land | Improvement |
|---|---|---|---|---|
| 2024 | $4,422 | $46,090 | $11,040 | $35,050 |
| 2023 | $4,463 | $46,090 | $11,040 | $35,050 |
| 2022 | $3,280 | $32,270 | $7,830 | $24,440 |
| 2021 | $3,405 | $32,270 | $7,830 | $24,440 |
| 2020 | $3,297 | $31,970 | $6,910 | $25,060 |
| 2019 | $3,308 | $31,970 | $6,910 | $25,060 |
| 2018 | $3,051 | $29,000 | $5,260 | $23,740 |
| 2017 | $2,879 | $29,000 | $5,260 | $23,740 |
| 2016 | $2,627 | $26,010 | $5,450 | $20,560 |
| 2015 | $1,338 | $26,010 | $5,450 | $20,560 |
| 2014 | $2,403 | $22,050 | $4,780 | $17,270 |
Source: Public Records
Map
Nearby Homes
- 4432 W Mountain Vista Ln
- 4688 Cedar Glen Place
- 4731 Sunridge Terrace Dr
- 4310 Old Windmill Way
- 4467 Trailside Ln
- 4337 Broken Hill Dr
- 5018 Apache Creek Rd
- 4985 Bear Paw Dr
- 4665 Bobolink Dr
- 4090 Forever Cir
- 4061 Forever Cir
- 3968 Tangerine Ct
- 5071 Buttercup Dr
- 4054 Sandia Trail
- 3797 Windriver Trail
- 3644 Sunridge Terrace Dr
- 4248 Bountiful Cir
- 4535 Addenbrooke Loop
- 3572 Elk Run Dr
- 5045 Stonecrop Cir
- 4665 Charing Ct
- 4629 Charing Ct
- 4683 Charing Ct
- 4617 Charing Ct
- 4648 Charing Ct
- 4701 Charing Ct
- 4620 Charing Ct
- 4624 Charing Ct
- 4696 Charing Ct
- 4531 Ridgewood Ct
- 4550 Ridgewood Ct
- 4661 Larksong Dr
- 4685 Larksong Dr
- 4551 Ridgewood Ct
- 4433 Charing Dr
- 4570 Ridgewood Ct
- 6065 S Meadow Lark Place
- 4373 Larksong Ct
- 4767 Rocky Mountain Dr
- 4465 Charing Dr