
Seller's Agent in 2025
Harry Timuryan
Beverly and Company, Inc.
(818) 482-1849
2 in this area
30 Total Sales
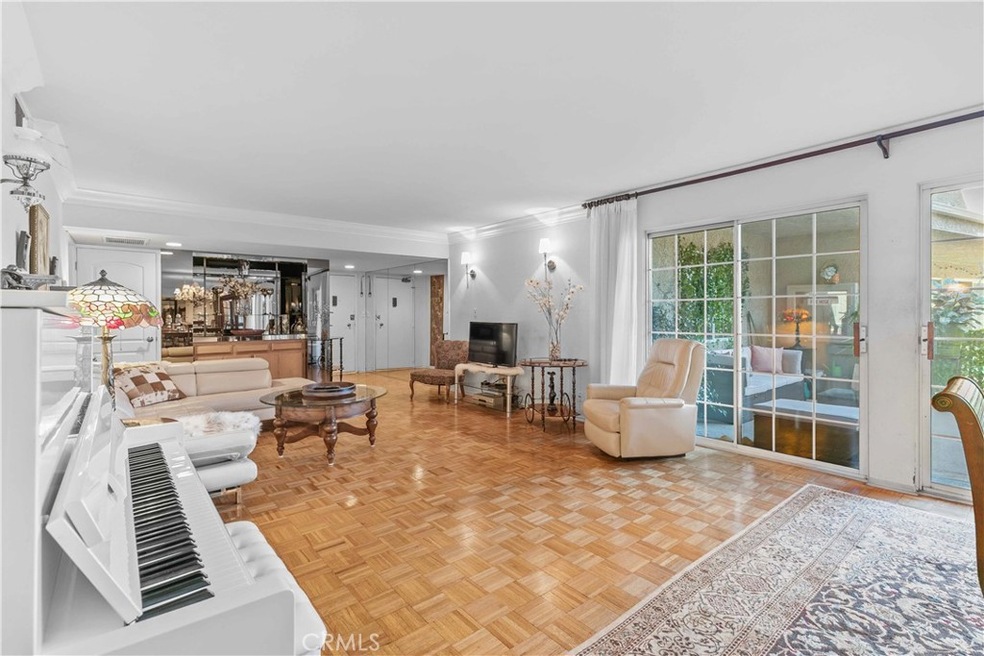
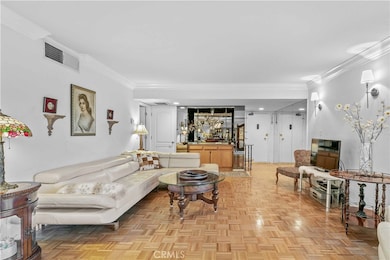
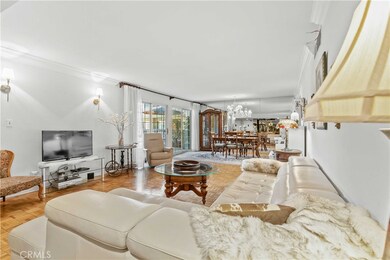
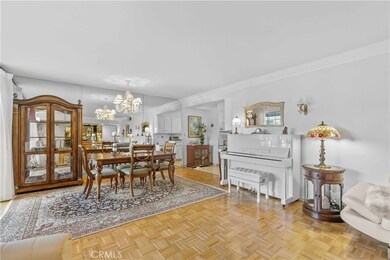
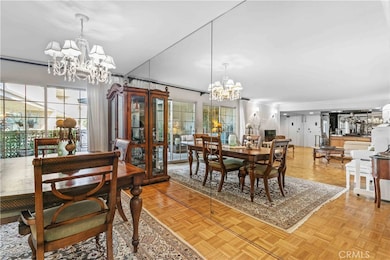
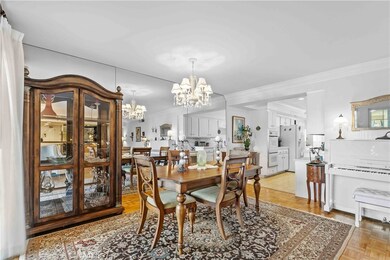
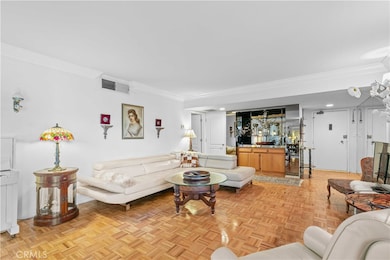
Welcome to this spacious single-story condominium located on Willis Avenue, just steps from Ventura Boulevard’s vibrant dining, shopping, and entertainment scene. Trader Joe’s, Whole Foods, and easy access to the 101 and 405 freeways make this an ideal location for both convenience and lifestyle. Offering 3 bedrooms, 2 bathrooms, and approximately 1,617 sq. ft. of living space, this home features an open-concept floor plan with hardwood floors, in-unit laundry, and a bright, inviting atmosphere. The private patio provides the perfect setting for outdoor dining or relaxation. A rare find in Sherman Oaks, the property includes five parking spaces—including a private covered two-car garage. The community also offers a refreshing swimming pool for residents to enjoy. This is a unique opportunity to own a spacious, well-appointed condo in one of the Valley’s most desirable neighborhoods.
Last Agent to Sell the Property
Beverly and Company, Inc. Brokerage Phone: 818-482-1849 License #01391637 Listed on: 09/04/2025
Last Buyer's Agent
Beverly and Company, Inc. Brokerage Phone: 818-482-1849 License #01391637 Listed on: 09/04/2025
| Date | Type | Sale Price | Title Company |
|---|---|---|---|
| Grant Deed | $623,000 | Fidelity National Title | |
| Interfamily Deed Transfer | -- | None Available | |
| Interfamily Deed Transfer | -- | Ticor Title Co | |
| Interfamily Deed Transfer | -- | -- | |
| Trustee Deed | $128,000 | Fidelity Title |
| Date | Status | Loan Amount | Loan Type |
|---|---|---|---|
| Open | $498,400 | New Conventional | |
| Previous Owner | $240,000 | New Conventional | |
| Previous Owner | $170,000 | New Conventional |
| Date | Event | Price | List to Sale | Price per Sq Ft |
|---|---|---|---|---|
| 10/24/2025 10/24/25 | Sold | $623,000 | 0.0% | $385 / Sq Ft |
| 09/25/2025 09/25/25 | Off Market | $623,000 | -- | -- |
| 09/17/2025 09/17/25 | For Sale | $609,900 | -2.1% | $377 / Sq Ft |
| 09/16/2025 09/16/25 | Pending | -- | -- | -- |
| 09/14/2025 09/14/25 | Off Market | $623,000 | -- | -- |
| 09/04/2025 09/04/25 | For Sale | $609,900 | -- | $377 / Sq Ft |
| Year | Tax Paid | Tax Assessment Tax Assessment Total Assessment is a certain percentage of the fair market value that is determined by local assessors to be the total taxable value of land and additions on the property. | Land | Improvement |
|---|---|---|---|---|
| 2025 | $5,241 | $436,469 | $261,600 | $174,869 |
| 2024 | $5,241 | $427,912 | $256,471 | $171,441 |
| 2023 | $5,139 | $419,523 | $251,443 | $168,080 |
| 2022 | $4,898 | $411,298 | $246,513 | $164,785 |
| 2021 | $4,830 | $403,234 | $241,680 | $161,554 |
| 2019 | $4,683 | $391,275 | $234,512 | $156,763 |
| 2018 | $4,651 | $383,604 | $229,914 | $153,690 |
| 2016 | $4,430 | $368,710 | $220,987 | $147,723 |
| 2015 | $4,364 | $363,173 | $217,668 | $145,505 |
| 2014 | $4,381 | $356,060 | $213,405 | $142,655 |
Seller's Agent in 2025
Harry Timuryan
Beverly and Company, Inc.
(818) 482-1849
2 in this area
30 Total Sales
Source: California Regional Multiple Listing Service (CRMLS)
MLS Number: BB25198714
APN: 2264-006-094
Disclaimer: Certain information contained herein is derived from information provided by parties other than Homes.com. All information provided is deemed reliable, but is not guaranteed to be accurate and should be independently verified.
![]() The multiple listing data appearing on this website, or contained in reports produced therefrom, is owned and copyrighted by California Regional Multiple Listing Service, Inc. ("CRMLS") and is protected by all applicable copyright laws. Information provided is for viewer's personal, non-commercial use and may not be used for any purpose other than to identify prospective properties the viewer may be interested in purchasing. All listing data, including but not limited to square footage and lot size is believed to be accurate, but the listing Agent, listing Broker and CRMLS and its affiliates do not warrant or guarantee such accuracy. The viewer should independently verify the listed data prior to making any decisions based on such information by personal inspection and/or contacting a real estate professional.
The multiple listing data appearing on this website, or contained in reports produced therefrom, is owned and copyrighted by California Regional Multiple Listing Service, Inc. ("CRMLS") and is protected by all applicable copyright laws. Information provided is for viewer's personal, non-commercial use and may not be used for any purpose other than to identify prospective properties the viewer may be interested in purchasing. All listing data, including but not limited to square footage and lot size is believed to be accurate, but the listing Agent, listing Broker and CRMLS and its affiliates do not warrant or guarantee such accuracy. The viewer should independently verify the listed data prior to making any decisions based on such information by personal inspection and/or contacting a real estate professional.
Based on information from California Regional Multiple Listing Service, Inc. and /or other sources. All data, including all measurements and calculations of area, is obtained from various sources and has not been, and will not be, verified by broker or MLS. All information should be independently reviewed and verified for accuracy. Properties may or may not be listed by the office/agent presenting the information