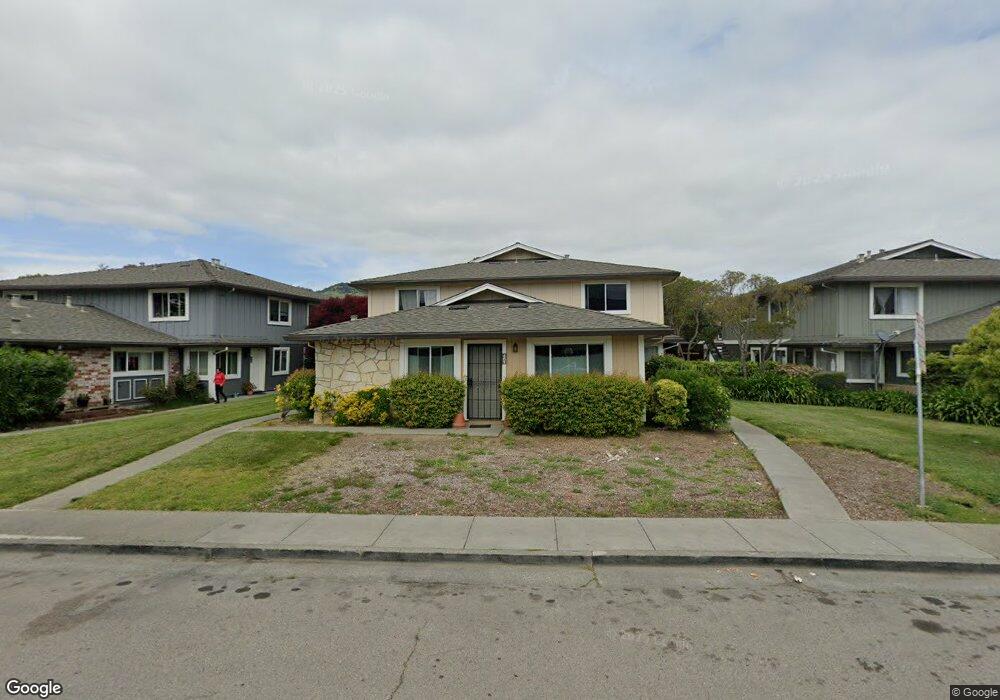
465 Bahia Way Unit 493 San Rafael, CA 94901
Canal NeighborhoodEstimated Value: $393,224 - $452,000
2
Beds
1
Bath
903
Sq Ft
$469/Sq Ft
Est. Value
About This Home
This home is located at 465 Bahia Way Unit 493, San Rafael, CA 94901 and is currently estimated at $423,056, approximately $468 per square foot. 465 Bahia Way Unit 493 is a home located in Marin County with nearby schools including Bahia Vista Elementary School, James B. Davidson Middle School, and San Rafael High School.
Ownership History
Date
Name
Owned For
Owner Type
Purchase Details
Closed on
Aug 12, 2015
Sold by
Keselman Vitaliy and Keselman Ninel
Bought by
Keselman Living Trust
Current Estimated Value
Purchase Details
Closed on
Nov 20, 2004
Sold by
Keselman Vitaliy
Bought by
Keselman Vitaliy and Keselman Ninel
Purchase Details
Closed on
May 4, 1999
Sold by
Joshua Azar
Bought by
Keselman Vitally
Home Financials for this Owner
Home Financials are based on the most recent Mortgage that was taken out on this home.
Original Mortgage
$92,000
Outstanding Balance
$23,535
Interest Rate
6.92%
Estimated Equity
$399,521
Purchase Details
Closed on
May 3, 1999
Sold by
Keselman Ninel
Bought by
Keselman Vitally
Home Financials for this Owner
Home Financials are based on the most recent Mortgage that was taken out on this home.
Original Mortgage
$92,000
Outstanding Balance
$23,535
Interest Rate
6.92%
Estimated Equity
$399,521
Create a Home Valuation Report for This Property
The Home Valuation Report is an in-depth analysis detailing your home's value as well as a comparison with similar homes in the area
Home Values in the Area
Average Home Value in this Area
Purchase History
| Date | Buyer | Sale Price | Title Company |
|---|---|---|---|
| Keselman Living Trust | -- | None Available | |
| Keselman Vitaliy | -- | -- | |
| Keselman Vitally | $115,000 | First American Title Co | |
| Keselman Vitally | -- | First American Title Co |
Source: Public Records
Mortgage History
| Date | Status | Borrower | Loan Amount |
|---|---|---|---|
| Open | Keselman Vitally | $92,000 | |
| Closed | Keselman Vitally | $11,500 |
Source: Public Records
Tax History Compared to Growth
Tax History
| Year | Tax Paid | Tax Assessment Tax Assessment Total Assessment is a certain percentage of the fair market value that is determined by local assessors to be the total taxable value of land and additions on the property. | Land | Improvement |
|---|---|---|---|---|
| 2025 | $4,107 | $180,274 | $63,096 | $117,178 |
| 2024 | $4,107 | $176,740 | $61,859 | $114,881 |
| 2023 | $3,962 | $173,275 | $60,646 | $112,629 |
| 2022 | $3,806 | $169,878 | $59,457 | $110,421 |
| 2021 | $3,748 | $166,548 | $58,292 | $108,256 |
| 2020 | $3,664 | $164,840 | $57,694 | $107,146 |
| 2019 | $3,506 | $161,609 | $56,563 | $105,046 |
| 2018 | $3,466 | $158,440 | $55,454 | $102,986 |
| 2017 | $3,362 | $155,334 | $54,367 | $100,967 |
| 2016 | $3,229 | $152,289 | $53,301 | $98,988 |
| 2015 | $3,092 | $150,001 | $52,500 | $97,501 |
| 2014 | $2,938 | $147,063 | $51,472 | $95,591 |
Source: Public Records
Map
Nearby Homes
- 3665 Kerner Blvd Unit B
- 3665 Kerner Blvd Unit D
- 22 Fairfax St Unit B
- 231 Playa Del Rey
- 35 Fairfax St Unit 8
- 163 Bahia Cir
- 199 Canal St Unit 6
- 120 Canal St
- 80 Baypoint Dr
- 139 Nantucket Cove
- 110 Baypoint Dr Unit 2
- 55 Dowitcher Way
- 124 Baypoint Dr
- 20 Porto Bello Dr
- 13 Hingham Cove
- 29 Porto Bello Dr
- 48 Porto Bello Dr
- 9 Porto Bello Dr
- 21 Marina Blvd
- 56 Mooring Rd Unit 2
- 463 Bahia Way
- 467 Bahia Way
- 461 Bahia Way
- 475 Bahia Way
- 477 Bahia Way Unit 4
- 471 Bahia Way Unit 501
- 473 Bahia Way
- 453 Bahia Way Unit 2
- 457 Bahia Way
- 451 Bahia Way
- 455 Bahia Way
- 287 Bahia Ln Unit 4
- 279 Bahia Ln
- 275 Bahia Ln
- 445 Bahia Way Unit 3
- 285 Bahia Ln
- 447 Bahia Way
- 470 Bahia Way
- 283 Bahia Ln Unit 2
- 468 Bahia Way