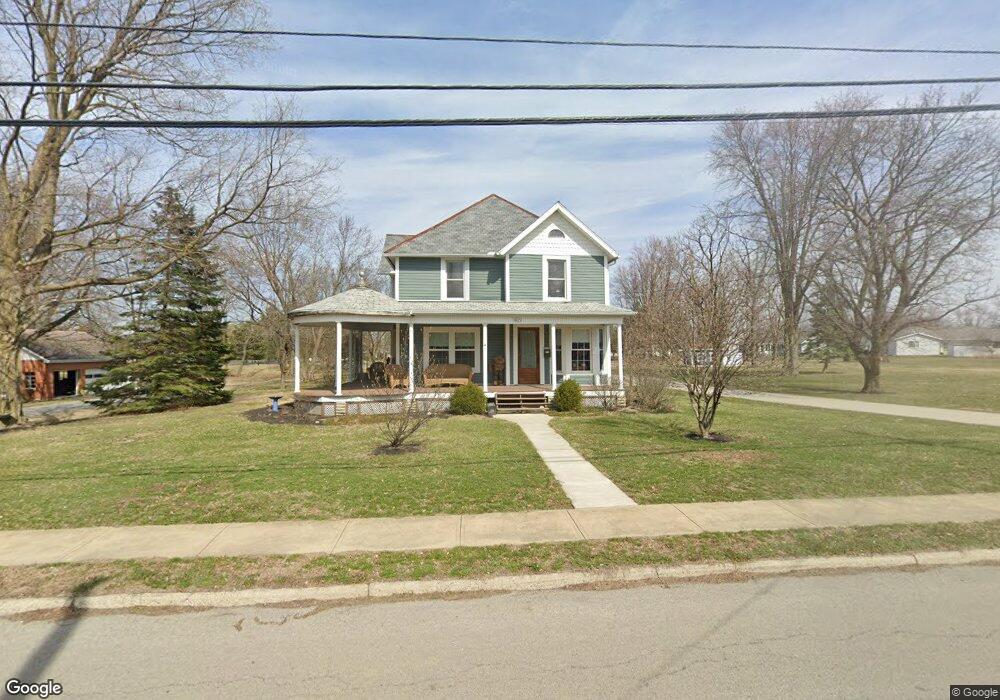
465 Cherry St Bluffton, OH 45817
Estimated Value: $254,000 - $349,473
3
Beds
2
Baths
2,658
Sq Ft
$119/Sq Ft
Est. Value
About This Home
This home is located at 465 Cherry St, Bluffton, OH 45817 and is currently estimated at $317,618, approximately $119 per square foot. 465 Cherry St is a home located in Allen County with nearby schools including Bluffton Elementary School, Bluffton Middle School, and Bluffton High School.
Ownership History
Date
Name
Owned For
Owner Type
Purchase Details
Closed on
Jul 31, 2012
Sold by
Dudgeon Paul David and Dudgeon Bonnie Jo
Bought by
Wilson Brent D and Wilson Jennifer J
Current Estimated Value
Home Financials for this Owner
Home Financials are based on the most recent Mortgage that was taken out on this home.
Original Mortgage
$131,800
Outstanding Balance
$89,251
Interest Rate
3.65%
Mortgage Type
Future Advance Clause Open End Mortgage
Estimated Equity
$228,367
Purchase Details
Closed on
Jun 15, 2009
Sold by
Dudgeon Paul D and Dudgeon Bonnie J
Bought by
Parkins William H and Vanschoyck Christopher E
Home Financials for this Owner
Home Financials are based on the most recent Mortgage that was taken out on this home.
Original Mortgage
$80,000
Interest Rate
4%
Mortgage Type
Seller Take Back
Purchase Details
Closed on
Jan 1, 1970
Bought by
Dudgeon Paul David
Create a Home Valuation Report for This Property
The Home Valuation Report is an in-depth analysis detailing your home's value as well as a comparison with similar homes in the area
Home Values in the Area
Average Home Value in this Area
Purchase History
| Date | Buyer | Sale Price | Title Company |
|---|---|---|---|
| Wilson Brent D | $120,000 | Attorney | |
| Dudgeon Paul D | -- | Attorney | |
| Parkins William H | $80,000 | Attorney | |
| Dudgeon Paul David | $11,500 | -- |
Source: Public Records
Mortgage History
| Date | Status | Borrower | Loan Amount |
|---|---|---|---|
| Open | Wilson Brent D | $131,800 | |
| Previous Owner | Parkins William H | $80,000 |
Source: Public Records
Tax History
| Year | Tax Paid | Tax Assessment Tax Assessment Total Assessment is a certain percentage of the fair market value that is determined by local assessors to be the total taxable value of land and additions on the property. | Land | Improvement |
|---|---|---|---|---|
| 2024 | $3,568 | $108,050 | $47,040 | $61,010 |
| 2023 | $2,748 | $77,180 | $33,600 | $43,580 |
| 2022 | $2,778 | $77,180 | $33,600 | $43,580 |
| 2021 | $2,796 | $77,180 | $33,600 | $43,580 |
| 2020 | $2,719 | $67,830 | $36,820 | $31,010 |
| 2019 | $2,719 | $67,830 | $36,820 | $31,010 |
| 2018 | $3,318 | $67,830 | $36,820 | $31,010 |
| 2017 | $3,156 | $63,770 | $36,820 | $26,950 |
| 2016 | $3,163 | $63,770 | $36,820 | $26,950 |
| 2015 | $1,273 | $42,320 | $15,370 | $26,950 |
| 2014 | $1,273 | $30,450 | $14,910 | $15,540 |
| 2013 | $1,165 | $30,140 | $14,910 | $15,230 |
Source: Public Records
Map
Nearby Homes
- 408 Cherry St
- 0 Ohio 103
- 328 N Main St
- 165 Thurman St
- 210 N Jackson St
- 307 S Main St Unit back
- 106 Riley St
- 222 N Lawn Ave
- 151 S Lawn Ave
- 513 S Jackson St
- 301 Parkview Dr
- 303 Parkview Dr
- 305 Parkview Dr
- 307 Parkview Dr
- 315 Parkview Dr
- 317 Parkview Dr
- 319 Parkview Dr
- 321 Parkview Dr
- 327 Parkview Dr
- 329 Parkview Dr
Your Personal Tour Guide
Ask me questions while you tour the home.