465 E 1100 S Mapleton, UT 84664
Estimated Value: $1,463,000 - $1,506,611
4
Beds
5
Baths
6,110
Sq Ft
$242/Sq Ft
Est. Value
About This Home
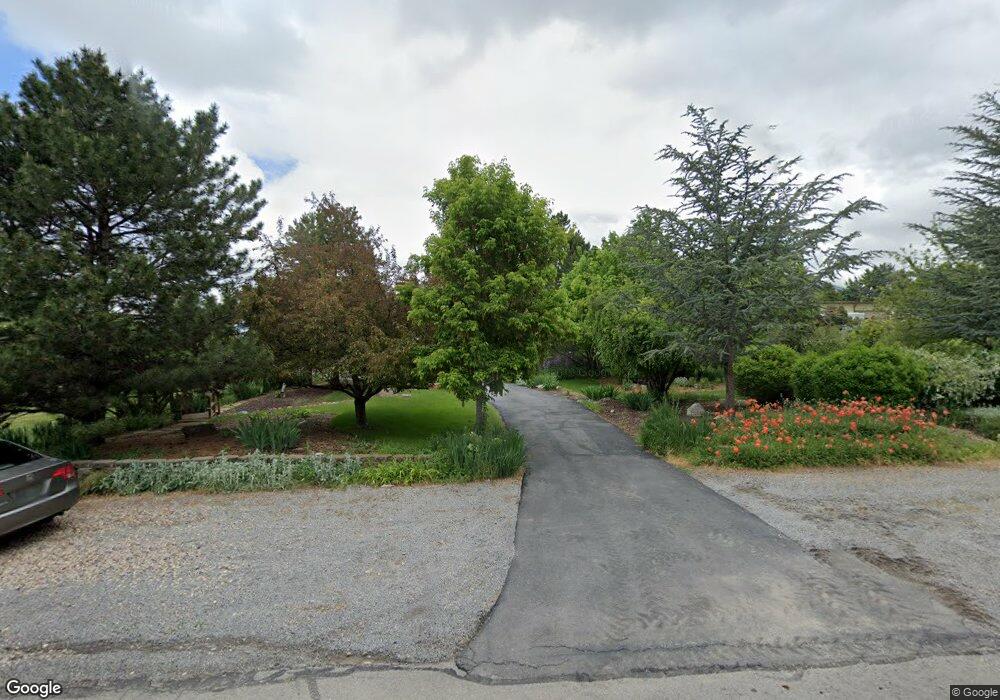
This home is located at 465 E 1100 S, Mapleton, UT 84664 and is currently estimated at $1,480,870, approximately $242 per square foot. 465 E 1100 S is a home located in Utah County with nearby schools including Mapleton School, Mapleton Junior High School, and Maple Mountain High School.
Ownership History
Date
Name
Owned For
Owner Type
Purchase Details
Closed on
Jun 28, 2021
Sold by
Norman And Helen Linton Revocable Living
Bought by
Vanbloem Paul Scott
Current Estimated Value
Home Financials for this Owner
Home Financials are based on the most recent Mortgage that was taken out on this home.
Original Mortgage
$830,000
Outstanding Balance
$749,823
Interest Rate
2.9%
Mortgage Type
New Conventional
Estimated Equity
$731,047
Purchase Details
Closed on
Jun 25, 2021
Sold by
Vanbloem Paul Scott
Bought by
Vanbloem Paul Scott and Vanbloem Van Bloem
Home Financials for this Owner
Home Financials are based on the most recent Mortgage that was taken out on this home.
Original Mortgage
$830,000
Outstanding Balance
$749,823
Interest Rate
2.9%
Mortgage Type
New Conventional
Estimated Equity
$731,047
Purchase Details
Closed on
Sep 17, 2020
Sold by
Linton N Kent N and Linton Helen
Bought by
Linton Norman Kent and Linton Helen Shchaeffer
Create a Home Valuation Report for This Property
The Home Valuation Report is an in-depth analysis detailing your home's value as well as a comparison with similar homes in the area
Home Values in the Area
Average Home Value in this Area
Purchase History
| Date | Buyer | Sale Price | Title Company |
|---|---|---|---|
| Vanbloem Paul Scott | -- | Metro National Title | |
| Vanbloem Paul Scott | -- | Metro National Title | |
| Vanbloem Paul Scott | -- | Metro National Title | |
| Vanbloern Paul Scot | -- | Metro National Title | |
| Linton Norman Kent | -- | None Available |
Source: Public Records
Mortgage History
| Date | Status | Borrower | Loan Amount |
|---|---|---|---|
| Open | Vanbloem Paul Scott | $830,000 | |
| Closed | Vanbloem Paul Scott | $830,000 | |
| Closed | Vanbloem Paul Scott | $830,000 |
Source: Public Records
Tax History
| Year | Tax Paid | Tax Assessment Tax Assessment Total Assessment is a certain percentage of the fair market value that is determined by local assessors to be the total taxable value of land and additions on the property. | Land | Improvement |
|---|---|---|---|---|
| 2025 | $8,148 | $844,145 | -- | -- |
| 2024 | $8,148 | $798,180 | $0 | $0 |
| 2023 | $8,296 | $817,870 | $0 | $0 |
| 2022 | $8,584 | $1,375,600 | $767,700 | $607,900 |
| 2021 | $6,407 | $861,700 | $429,000 | $432,700 |
| 2020 | $6,174 | $809,300 | $393,200 | $416,100 |
| 2019 | $5,613 | $786,600 | $383,200 | $403,400 |
| 2018 | $5,872 | $757,300 | $353,900 | $403,400 |
| 2017 | $5,888 | $439,520 | $0 | $0 |
| 2016 | $5,349 | $396,930 | $0 | $0 |
| 2015 | $4,852 | $357,880 | $0 | $0 |
| 2014 | $4,179 | $302,730 | $0 | $0 |
Source: Public Records
Map
Nearby Homes
- 2700 S Main St
- 15 W 1600 S
- 644 S 1330 E
- 4014 S Ironwood Ln
- 2254 715 S
- 4012 S Ironwood Ln Unit 424
- 2042 715 S
- 4695 S 690 W Unit U204
- 675 W 4500 S Unit P303
- 2057 E Maple Hills Ln
- 675 W 4500 S Unit P101
- 4695 S 690 W Unit U102
- 550 N 2000 E
- 675 W 4500 S Unit P203
- 675 W 4500 S Unit P301
- 4695 S 690 W Unit U101
- 2116 S Valley View Dr Unit 58
- 737 N 1970 W Unit 347
- 675 W 4500 S Unit P201
- 675 W 4500 S Unit P304
Your Personal Tour Guide
Ask me questions while you tour the home.