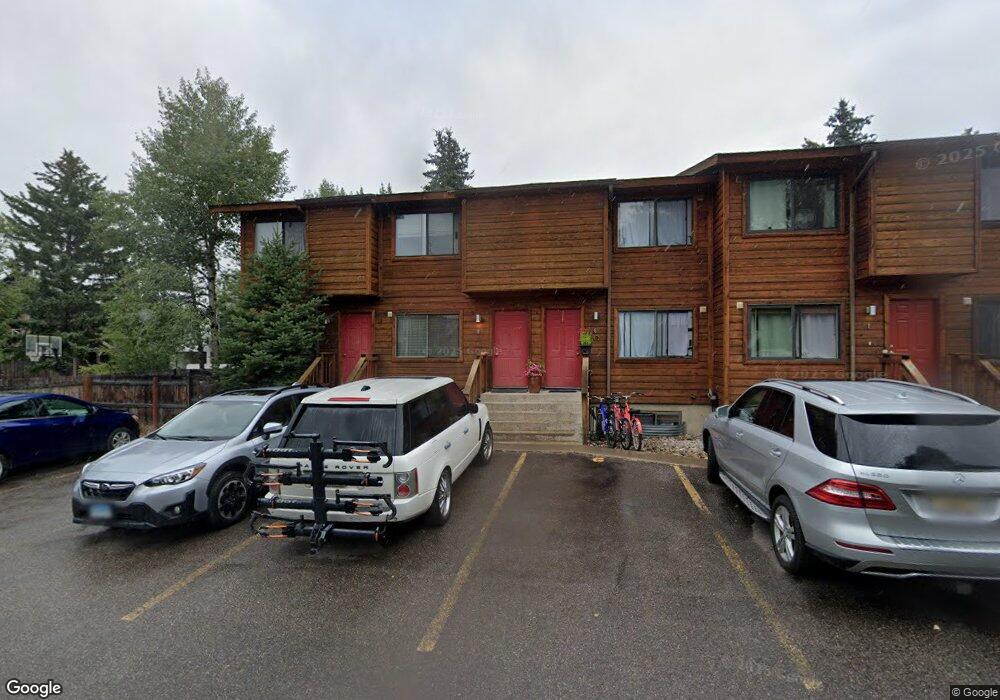
465 E Broadway Ave Unit A-8 Jackson, WY 83001
Estimated Value: $1,059,000 - $1,178,000
3
Beds
2
Baths
1,500
Sq Ft
$746/Sq Ft
Est. Value
About This Home
This home is located at 465 E Broadway Ave Unit A-8, Jackson, WY 83001 and is currently estimated at $1,119,540, approximately $746 per square foot. 465 E Broadway Ave Unit A-8 is a home located in Teton County with nearby schools including Jackson Elementary School, Jackson Hole Middle School, and Jackson Hole High School.
Ownership History
Date
Name
Owned For
Owner Type
Purchase Details
Closed on
May 19, 2017
Sold by
Carey Creek Capital Management Llc
Bought by
Fisher Jackson
Current Estimated Value
Home Financials for this Owner
Home Financials are based on the most recent Mortgage that was taken out on this home.
Original Mortgage
$408,000
Outstanding Balance
$338,555
Interest Rate
4.02%
Estimated Equity
$780,985
Purchase Details
Closed on
Aug 24, 2006
Sold by
Ackley Aaron P and Pryor Nicole E
Bought by
Smith W Britt W and Smith Karen T
Home Financials for this Owner
Home Financials are based on the most recent Mortgage that was taken out on this home.
Original Mortgage
$351,000
Interest Rate
6.8%
Mortgage Type
Adjustable Rate Mortgage/ARM
Purchase Details
Closed on
Jul 8, 2005
Sold by
Ackley Aaron P
Bought by
Ackley Aaron P and Pryor Nicole E
Create a Home Valuation Report for This Property
The Home Valuation Report is an in-depth analysis detailing your home's value as well as a comparison with similar homes in the area
Purchase History
We collect this data history from publicly available records. To have your information removed, we recommend requesting removal directly through your county’s website.
| Date | Buyer | Sale Price | Title Company |
|---|---|---|---|
| Fisher Jackson | -- | -- | |
| Smith W Britt W | -- | First American Title Insuran | |
| Ackley Aaron P | -- | Land Title Company |
Source: Public Records
Mortgage History
We collect this data history from publicly available records. To have your information removed, we recommend requesting removal directly through your county’s website.
| Date | Status | Borrower | Loan Amount |
|---|---|---|---|
| Open | Fisher Jackson | $408,000 | |
| Closed | Fisher Jackson | -- | |
| Previous Owner | Smith W Britt W | $351,000 |
Source: Public Records
Tax History
| Year | Tax Paid | Tax Assessment Tax Assessment Total Assessment is a certain percentage of the fair market value that is determined by local assessors to be the total taxable value of land and additions on the property. | Land | Improvement |
|---|---|---|---|---|
| 2025 | $6,129 | $88,536 | $3,296 | $85,240 |
| 2024 | $6,129 | $109,260 | $4,180 | $105,080 |
| 2023 | $5,976 | $106,284 | $4,180 | $102,104 |
| 2022 | $4,663 | $83,294 | $4,180 | $79,114 |
| 2021 | $3,250 | $57,034 | $4,180 | $52,854 |
| 2020 | $2,979 | $53,216 | $4,180 | $49,036 |
| 2019 | $2,876 | $50,417 | $4,180 | $46,237 |
| 2018 | $2,912 | $51,317 | $4,180 | $47,137 |
| 2017 | $2,445 | $42,188 | $4,180 | $38,008 |
| 2016 | $2,366 | $40,833 | $4,180 | $36,653 |
| 2015 | $1,456 | $38,313 | $4,180 | $34,133 |
| 2014 | $1,456 | $25,159 | $4,180 | $20,979 |
| 2013 | $1,456 | $25,159 | $4,180 | $20,979 |
Source: Public Records
Map
Nearby Homes
- 365 E Broadway Ave
- 514 E Pearl Ave
- 150 N Jean St
- 340 E Pearl Ave
- 415 Teton Ave
- 360 E Simpson Ave Unit 19
- 360 E Simpson Ave Unit 20
- 110 S Willow St
- 371 Snow King Loop
- 308 Hidden Hollow Dr
- 304 Hidden Hollow Dr
- 662 E Hansen Ave
- 680 E Hansen Ave
- 500 E Kelly Ave
- 452 E Kelly Ave
- 663&665 E Kelly Ave
- 667 E Kelly Ave
- 125 E Kelly Ave
- 555 Cache Creek Dr
- 630 E Kelly Ave
- 465 E Broadway Ave
- 465 E Broadway Ave Unit A-5
- 465 E Broadway Ave Unit D
- 465 E Broadway Ave Unit A-9
- 100 Moose St
- 460 E Deloney Ave
- 475 E Broadway Ave Unit F
- 475 E Broadway Ave Unit B-8
- 475 E Broadway Ave Unit E
- 475 E Broadway Ave
- 475 E Broadway Ave Unit B-9
- 475 E Broadway Ave Unit B-7
- 475 E Broadway Ave Unit B-3
- 475 E Broadway Ave Unit B-1
- LOT 1 Moose St
- 455 E Broadway Ave
- 475 E Deloney Ave
- 515 E Broadway
- LOTS 1 & 2 Moose St
- LOT 2 Moose St
Your Personal Tour Guide
Ask me questions while you tour the home.