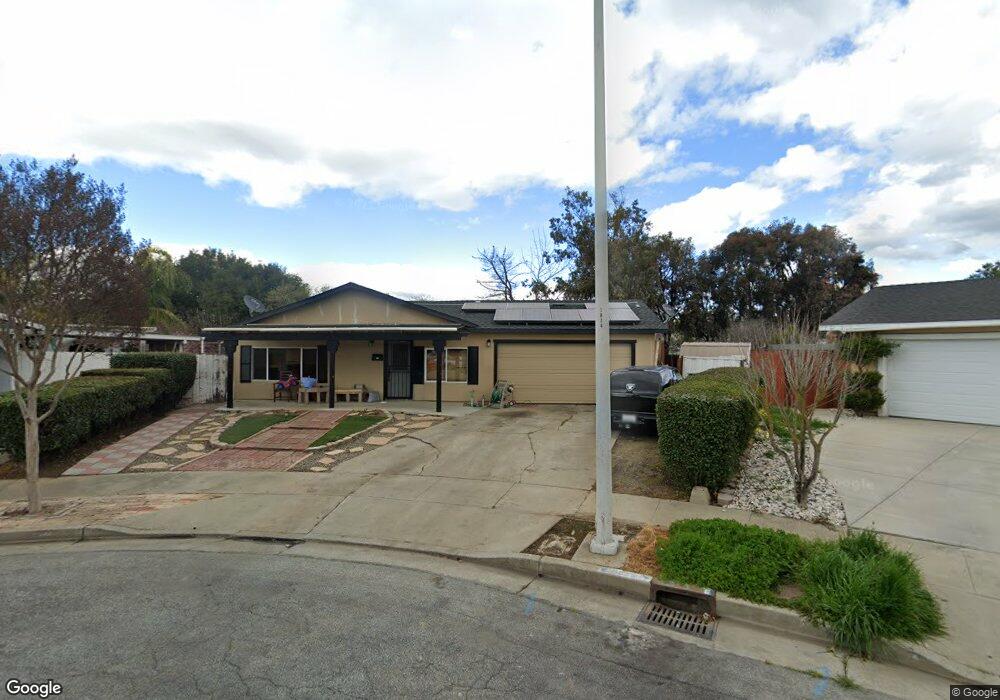
465 Gavilan Ct Gilroy, CA 95020
Estimated Value: $636,000 - $834,000
3
Beds
2
Baths
1,120
Sq Ft
$694/Sq Ft
Est. Value
About This Home
This home is located at 465 Gavilan Ct, Gilroy, CA 95020 and is currently estimated at $777,242, approximately $693 per square foot. 465 Gavilan Ct is a home located in Santa Clara County with nearby schools including Rucker Elementary School, South Valley Middle School, and Solorsano Middle School.
Ownership History
Date
Name
Owned For
Owner Type
Purchase Details
Closed on
Apr 22, 2024
Sold by
Stultz John Thomas and Wayland Sonya Renee
Bought by
Stultz John Thomas and Wayland Sonya Renee
Current Estimated Value
Home Financials for this Owner
Home Financials are based on the most recent Mortgage that was taken out on this home.
Original Mortgage
$675,620
Interest Rate
6.94%
Mortgage Type
FHA
Purchase Details
Closed on
Apr 23, 2021
Sold by
Wayland Sonya Renee
Bought by
Stultz John Thomas and Wayland Sonya Renee
Home Financials for this Owner
Home Financials are based on the most recent Mortgage that was taken out on this home.
Original Mortgage
$337,500
Interest Rate
3%
Mortgage Type
New Conventional
Purchase Details
Closed on
Nov 26, 2020
Sold by
Wayland Sonya and Martinez Alejandro A
Bought by
Wayland Sonya
Purchase Details
Closed on
May 25, 2017
Sold by
Martinez Alejandro
Bought by
The Alejandro Martinez Revocable Living
Create a Home Valuation Report for This Property
The Home Valuation Report is an in-depth analysis detailing your home's value as well as a comparison with similar homes in the area
Home Values in the Area
Average Home Value in this Area
Purchase History
| Date | Buyer | Sale Price | Title Company |
|---|---|---|---|
| Stultz John Thomas | -- | Silk Title & Escrow | |
| Stultz John Thomas | -- | First American Title Company | |
| Wayland Sonya | -- | None Available | |
| The Alejandro Martinez Revocable Living | -- | None Available |
Source: Public Records
Mortgage History
| Date | Status | Borrower | Loan Amount |
|---|---|---|---|
| Previous Owner | Stultz John Thomas | $675,620 | |
| Previous Owner | Stultz John Thomas | $337,500 |
Source: Public Records
Tax History
| Year | Tax Paid | Tax Assessment Tax Assessment Total Assessment is a certain percentage of the fair market value that is determined by local assessors to be the total taxable value of land and additions on the property. | Land | Improvement |
|---|---|---|---|---|
| 2025 | $6,678 | $552,287 | $300,751 | $251,536 |
| 2024 | $6,678 | $541,458 | $294,854 | $246,604 |
| 2023 | $6,637 | $530,842 | $289,073 | $241,769 |
| 2022 | $6,526 | $520,434 | $283,405 | $237,029 |
| 2021 | $6,495 | $510,231 | $277,849 | $232,382 |
| 2020 | $5,054 | $44,934 | $13,490 | $31,444 |
| 2019 | $5,048 | $44,054 | $13,226 | $30,828 |
| 2018 | $5,003 | $43,191 | $12,967 | $30,224 |
| 2017 | $4,904 | $42,345 | $12,713 | $29,632 |
| 2016 | $547 | $41,515 | $12,464 | $29,051 |
| 2015 | $518 | $40,892 | $12,277 | $28,615 |
| 2014 | $513 | $40,092 | $12,037 | $28,055 |
Source: Public Records
Map
Nearby Homes
- 0 Magic Springs Dr Unit ML82028522
- 0 Dorrance Rd Unit ML82002071
- 0000 Hecker Pass
- 700 Las Animas Ave
- 8282 Murray Ave Unit 99
- 8282 Murray Ave Unit 65
- 401 Arnold Dr
- 119 Farrell Ave
- 103 Farrell Ave
- 111 Farrell Ave
- 170 Sturla Way
- 620 Broadway
- 626 Broadway
- 7711 Monterey St
- 160 Sarafina Way
- 622 Broadway
- 760 Welburn Ave
- 7621 Forest St
- 730 Lepa Ct
- 7691 Church St Unit B
Your Personal Tour Guide
Ask me questions while you tour the home.