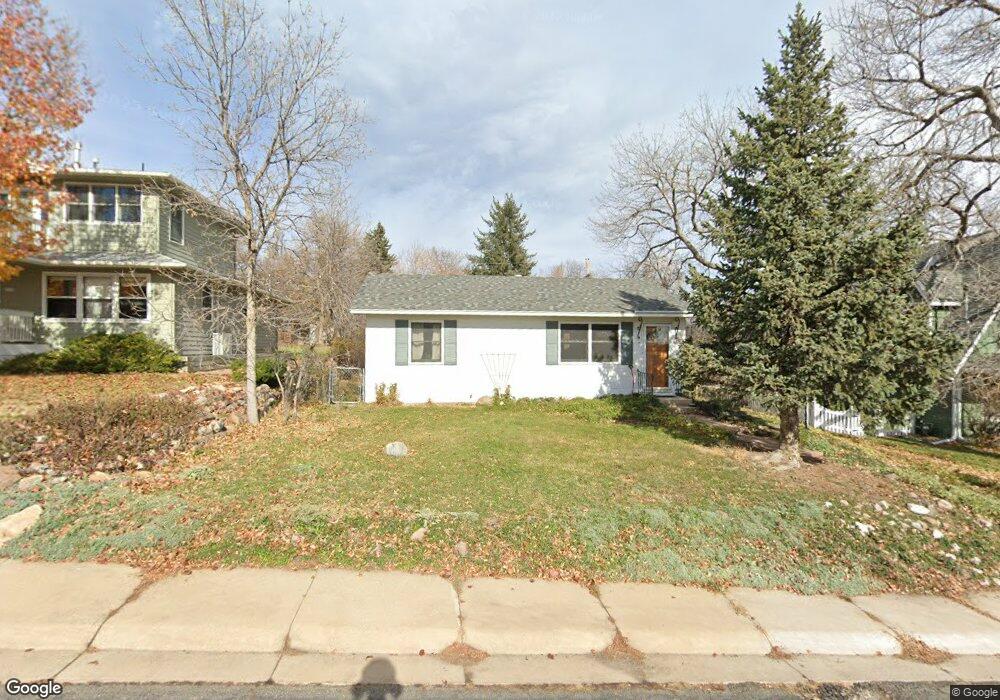
465 Grape Ave Boulder, CO 80304
Newlands NeighborhoodEstimated Value: $957,784 - $1,214,000
About This Home
This home is located at 465 Grape Ave, Boulder, CO 80304 and is currently estimated at $1,122,696, approximately $1,278 per square foot. 465 Grape Ave is a home located in Boulder County with nearby schools including Foothill Elementary School, Casey Middle School, and Boulder High School.
Ownership History
We collect this data history from publicly available records. To have your information removed, we recommend requesting removal directly through your county’s website.
Purchase Details
Purchase Details
Purchase Details
Purchase Details
Home Values in the Area
Average Home Value in this Area
Purchase History
We collect this data history from publicly available records. To have your information removed, we recommend requesting removal directly through your county’s website.
| Date | Buyer | Sale Price | Title Company |
|---|---|---|---|
| -- | None Listed On Document | ||
| -- | None Listed On Document | ||
| -- | -- | ||
| $43,000 | -- | ||
| $34,000 | -- |
Tax History
We collect this data history from publicly available records. To have your information removed, we recommend requesting removal directly through your county’s website.
| Year | Tax Paid | Tax Assessment Tax Assessment Total Assessment is a certain percentage of the fair market value that is determined by local assessors to be the total taxable value of land and additions on the property. | Land | Improvement |
|---|---|---|---|---|
| 2026 | $5,553 | $62,438 | $56,194 | $6,244 |
| 2025 | $5,553 | $62,438 | $56,194 | $6,244 |
| 2024 | $5,474 | $57,388 | $51,649 | $5,739 |
| 2023 | $5,376 | $61,385 | $58,563 | $6,507 |
| 2022 | $4,379 | $46,343 | $41,707 | $4,636 |
| 2021 | $4,179 | $47,676 | $42,907 | $4,769 |
| 2020 | $3,882 | $44,602 | $35,679 | $8,923 |
| 2019 | $3,823 | $44,602 | $35,679 | $8,923 |
| 2018 | $3,597 | $41,486 | $33,192 | $8,294 |
| 2017 | $3,484 | $45,866 | $36,696 | $9,170 |
| 2016 | $3,428 | $39,601 | $31,681 | $7,920 |
| 2015 | $3,246 | $28,656 | $19,104 | $9,552 |
| 2014 | $2,409 | $28,656 | $19,104 | $9,552 |
Map
- 445 Grape Ave
- 445 Grape Ave Unit 1
- 445 Grape Ave Unit 445 Grape Ave, Unit
- 462 Hawthorn Ave
- 415 Grape Ave
- 500 Hawthorn Ave
- 440 Hawthorn Ave
- 3250 5th St
- 3265 5th St
- 420 Hawthorn Ave
- 440 Grape Ave
- 512 Hawthorn Ave
- 3248 5th St
- 3272 4th St
- 3282 4th St
- 3262 4th St
- 3292 4th St
- 530 Hawthorn Ave
- 3235 5th St
- 3246 5th St
Ask me questions while you tour the home.