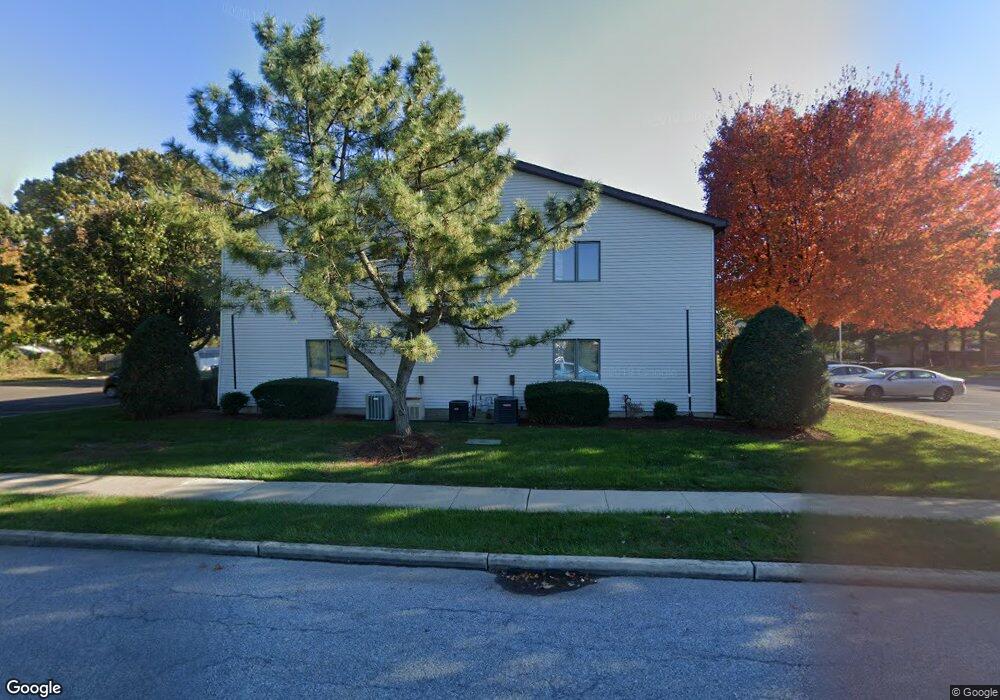
465 Locust Ave Unit 3201 Pitman, NJ 08071
Estimated Value: $221,000 - $242,080
2
Beds
2
Baths
1,161
Sq Ft
$200/Sq Ft
Est. Value
About This Home
This home is located at 465 Locust Ave Unit 3201, Pitman, NJ 08071 and is currently estimated at $232,270, approximately $200 per square foot. 465 Locust Ave Unit 3201 is a home located in Gloucester County with nearby schools including Elwood Kindle School, Pitman Middle School, and Pitman High School.
Ownership History
Date
Name
Owned For
Owner Type
Purchase Details
Closed on
Dec 17, 2019
Sold by
Tully Kathleen
Bought by
Pierantozzi Maria and Goodhines Thomas
Current Estimated Value
Home Financials for this Owner
Home Financials are based on the most recent Mortgage that was taken out on this home.
Original Mortgage
$95,000
Outstanding Balance
$83,756
Interest Rate
3.6%
Mortgage Type
New Conventional
Estimated Equity
$148,514
Purchase Details
Closed on
Aug 15, 2007
Sold by
Shainline Ryan C and Shainline Stephanie L
Bought by
Tully Kathleen
Purchase Details
Closed on
Jan 30, 2004
Sold by
Robinson R Daniel and Robinson Marcia
Bought by
Seran Stephanie
Home Financials for this Owner
Home Financials are based on the most recent Mortgage that was taken out on this home.
Original Mortgage
$78,850
Interest Rate
5.82%
Mortgage Type
Purchase Money Mortgage
Purchase Details
Closed on
Dec 14, 2001
Sold by
Groff Rev Audrey and Groff Gloria
Bought by
Robinson R Daniel
Create a Home Valuation Report for This Property
The Home Valuation Report is an in-depth analysis detailing your home's value as well as a comparison with similar homes in the area
Home Values in the Area
Average Home Value in this Area
Purchase History
| Date | Buyer | Sale Price | Title Company |
|---|---|---|---|
| Pierantozzi Maria | $100,000 | Trident Land Transfer Co | |
| Tully Kathleen | $155,000 | Homestead Title Agency | |
| Seran Stephanie | -- | Homestead Title Agency Via E | |
| Robinson R Daniel | $72,000 | -- |
Source: Public Records
Mortgage History
| Date | Status | Borrower | Loan Amount |
|---|---|---|---|
| Open | Pierantozzi Maria | $95,000 | |
| Previous Owner | Seran Stephanie | $78,850 |
Source: Public Records
Tax History Compared to Growth
Tax History
| Year | Tax Paid | Tax Assessment Tax Assessment Total Assessment is a certain percentage of the fair market value that is determined by local assessors to be the total taxable value of land and additions on the property. | Land | Improvement |
|---|---|---|---|---|
| 2025 | $4,227 | $121,000 | $27,500 | $93,500 |
| 2024 | $4,115 | $121,000 | $27,500 | $93,500 |
| 2023 | $4,115 | $121,000 | $27,500 | $93,500 |
| 2022 | $3,953 | $121,000 | $27,500 | $93,500 |
| 2021 | $4,268 | $95,200 | $27,000 | $68,200 |
| 2020 | $4,217 | $95,200 | $27,000 | $68,200 |
| 2019 | $4,118 | $95,200 | $27,000 | $68,200 |
| 2018 | $4,049 | $95,200 | $27,000 | $68,200 |
| 2017 | $3,998 | $95,200 | $27,000 | $68,200 |
| 2016 | $3,921 | $95,200 | $27,000 | $68,200 |
| 2015 | $3,816 | $95,200 | $27,000 | $68,200 |
| 2014 | $3,699 | $95,200 | $27,000 | $68,200 |
Source: Public Records
Map
Nearby Homes
- 30 N Woodbury Rd
- 534 Wayne Ave
- 149 N Fernwood Ave
- 138 N Fernwood Ave
- 163 E Holly Ave
- 1072 Prime Place
- 1024 Prime Place
- 32 Nature Ln
- 1052 Noble Place
- 178 Esplanade Ave
- 14 Autumn Ln
- 302 Montgomery Ave
- 128 Oakcrest Ave
- 141 Crafton Ave
- 225 Lexington Ave
- 26 East Ave
- 128 Washington Ave
- 134 1st Ave
- 127 3rd Ave
- 72 Cyrus Ave
- 465 Locust Ave Unit 3103
- 465 Locust Ave Unit 3102
- 465 Locust Ave Unit 3101
- 465 Locust Ave Unit 3202
- 470 Locust Ave Unit 3103
- 470 Locust Ave Unit 2204
- 470 Locust Ave Unit 2102
- 470 Locust Ave Unit 3204
- 470 Locust Ave Unit 2104
- 470 Locust Ave Unit 3203
- 470 Locust Ave Unit 2202
- 470 Locust Ave Unit 2103
- 470 Locust Ave Unit 2101
- 470 Locust Ave Unit 3104
- 470 Locust Ave Unit 2102 - BUILDING 2
- 455 Locust Ave
- 455 Locust Ave Unit 4202
- 455 Locust Ave Unit 4201
- 455 Locust Ave Unit 4204
- 455 Locust Ave Unit 4101