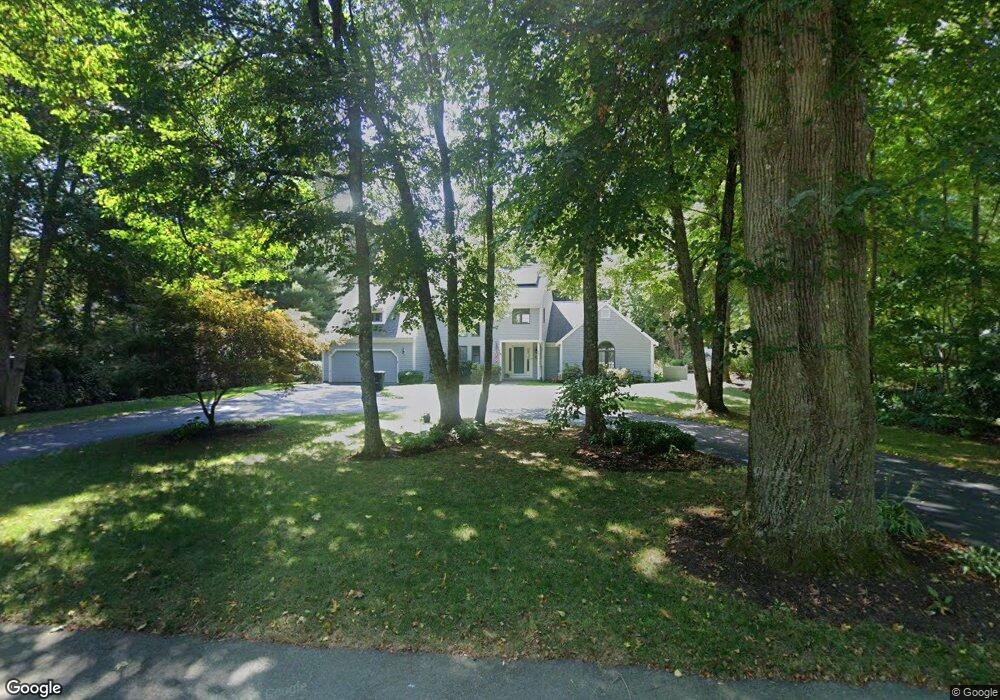
465 Main St Cotuit, MA 02635
Cotuit NeighborhoodEstimated Value: $1,135,853 - $1,468,000
3
Beds
3
Baths
2,602
Sq Ft
$488/Sq Ft
Est. Value
About This Home
This home is located at 465 Main St, Cotuit, MA 02635 and is currently estimated at $1,269,713, approximately $487 per square foot. 465 Main St is a home located in Barnstable County with nearby schools including West Villages Elementary School, Barnstable United Elementary School, and Barnstable Intermediate School.
Ownership History
Date
Name
Owned For
Owner Type
Purchase Details
Closed on
Jun 24, 2011
Sold by
William J Lynch Ft and Lynch Marie T
Bought by
Vanheynigen Mark D and Vanheynigen Maris B
Current Estimated Value
Home Financials for this Owner
Home Financials are based on the most recent Mortgage that was taken out on this home.
Original Mortgage
$414,400
Outstanding Balance
$281,537
Interest Rate
4.63%
Mortgage Type
Purchase Money Mortgage
Estimated Equity
$988,176
Purchase Details
Closed on
Jun 7, 1994
Sold by
Doyle Noreen M
Bought by
Lynch William J and Lynch Marie T
Purchase Details
Closed on
Mar 9, 1990
Sold by
Mcshane John J
Bought by
Doyle Noreen M
Create a Home Valuation Report for This Property
The Home Valuation Report is an in-depth analysis detailing your home's value as well as a comparison with similar homes in the area
Home Values in the Area
Average Home Value in this Area
Purchase History
| Date | Buyer | Sale Price | Title Company |
|---|---|---|---|
| Vanheynigen Mark D | $518,000 | -- | |
| Lynch William J | $279,000 | -- | |
| Doyle Noreen M | $252,000 | -- |
Source: Public Records
Mortgage History
| Date | Status | Borrower | Loan Amount |
|---|---|---|---|
| Open | Vanheynigen Mark D | $414,400 | |
| Previous Owner | Doyle Noreen M | $175,000 |
Source: Public Records
Tax History
| Year | Tax Paid | Tax Assessment Tax Assessment Total Assessment is a certain percentage of the fair market value that is determined by local assessors to be the total taxable value of land and additions on the property. | Land | Improvement |
|---|---|---|---|---|
| 2025 | $7,958 | $953,100 | $388,000 | $565,100 |
| 2024 | $7,600 | $964,500 | $388,000 | $576,500 |
| 2023 | $6,841 | $817,300 | $360,700 | $456,600 |
| 2022 | $6,942 | $671,400 | $249,400 | $422,000 |
| 2021 | $7,085 | $641,700 | $273,100 | $368,600 |
| 2020 | $7,143 | $610,000 | $273,100 | $336,900 |
| 2019 | $6,774 | $570,200 | $285,000 | $285,200 |
| 2018 | $6,914 | $582,000 | $287,500 | $294,500 |
| 2017 | $6,751 | $572,100 | $287,500 | $284,600 |
| 2016 | $6,585 | $572,100 | $287,500 | $284,600 |
| 2015 | $6,430 | $558,200 | $285,200 | $273,000 |
Source: Public Records
Map
Nearby Homes
- 239 Oxford Dr
- 804 Main St
- 135 Putnam Avenue (Land)
- 916 Main St
- 33 Oyster Place Rd
- 226 Dunrobin Rd
- 602 Putnam Ave
- 70 Cape Dr Unit 14D
- 70 Cape Dr Unit 11D
- 70 Cape Dr Unit 11D
- 30 Wings Ln
- 1081 Main St
- 70 Simons Rd Unit E
- 70 Simons Rd
- 75 Bob White Run
- 1456 Santuit-Newtown Rd
- 16 Spring Brook Ln
- 6 Cedar St
- 6 Cedar St
- 188 Ocean View Ave
Your Personal Tour Guide
Ask me questions while you tour the home.