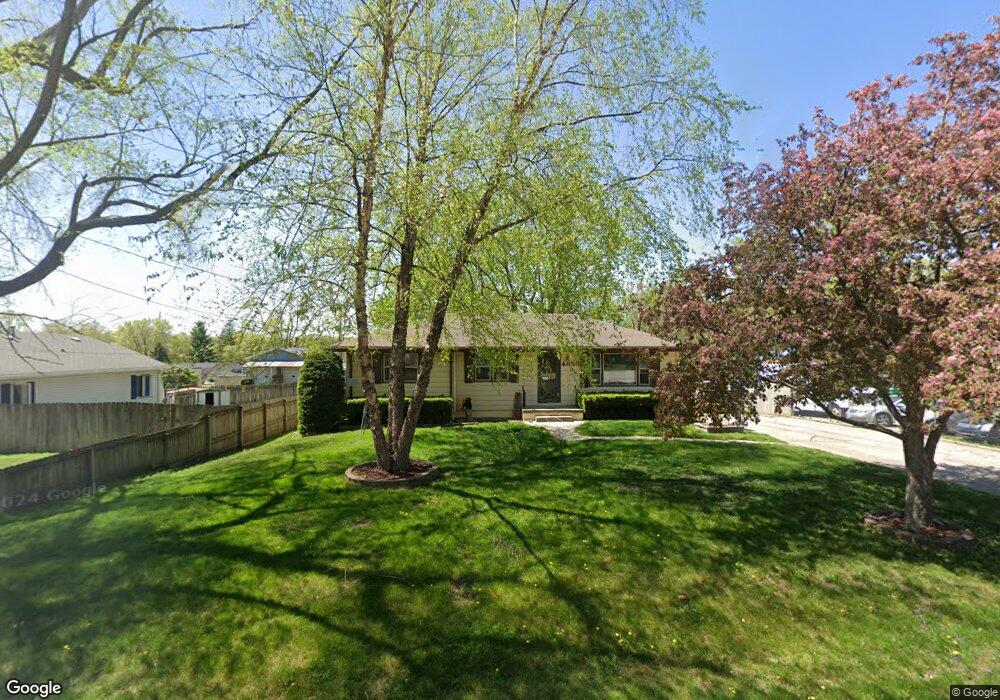
4650 NE 29th St Des Moines, IA 50317
Norwoodville NeighborhoodEstimated Value: $225,366 - $273,000
3
Beds
1
Bath
1,132
Sq Ft
$216/Sq Ft
Est. Value
About This Home
This home is located at 4650 NE 29th St, Des Moines, IA 50317 and is currently estimated at $244,092, approximately $215 per square foot. 4650 NE 29th St is a home located in Polk County with nearby schools including Cornell Elementary School, Woodside Middle School, and Saydel High School.
Ownership History
Date
Name
Owned For
Owner Type
Purchase Details
Closed on
Jul 19, 2017
Sold by
Myers Raymond
Bought by
Myers Mindy
Current Estimated Value
Home Financials for this Owner
Home Financials are based on the most recent Mortgage that was taken out on this home.
Original Mortgage
$114,500
Outstanding Balance
$95,156
Interest Rate
3.9%
Mortgage Type
New Conventional
Estimated Equity
$148,936
Purchase Details
Closed on
Oct 17, 2011
Sold by
Myers Raymond A and Myers Mindy
Bought by
Myers Mindy and Myers Raymond
Home Financials for this Owner
Home Financials are based on the most recent Mortgage that was taken out on this home.
Original Mortgage
$127,700
Interest Rate
4.12%
Mortgage Type
New Conventional
Purchase Details
Closed on
Apr 26, 2005
Sold by
Bougher Fern and Bougher Fern Deloris
Bought by
Myers Raymond A and Kern Mindy J
Home Financials for this Owner
Home Financials are based on the most recent Mortgage that was taken out on this home.
Original Mortgage
$104,000
Interest Rate
6.06%
Mortgage Type
Fannie Mae Freddie Mac
Create a Home Valuation Report for This Property
The Home Valuation Report is an in-depth analysis detailing your home's value as well as a comparison with similar homes in the area
Home Values in the Area
Average Home Value in this Area
Purchase History
| Date | Buyer | Sale Price | Title Company |
|---|---|---|---|
| Myers Mindy | -- | None Available | |
| Myers Mindy | -- | None Available | |
| Myers Raymond A | $129,500 | -- |
Source: Public Records
Mortgage History
| Date | Status | Borrower | Loan Amount |
|---|---|---|---|
| Open | Myers Mindy | $114,500 | |
| Closed | Myers Mindy | $127,700 | |
| Closed | Myers Raymond A | $104,000 |
Source: Public Records
Tax History Compared to Growth
Tax History
| Year | Tax Paid | Tax Assessment Tax Assessment Total Assessment is a certain percentage of the fair market value that is determined by local assessors to be the total taxable value of land and additions on the property. | Land | Improvement |
|---|---|---|---|---|
| 2025 | $2,786 | $235,900 | $41,000 | $194,900 |
| 2024 | $2,786 | $214,000 | $36,300 | $177,700 |
| 2023 | $2,604 | $214,000 | $36,300 | $177,700 |
| 2022 | $2,556 | $169,600 | $30,000 | $139,600 |
| 2021 | $2,502 | $169,600 | $30,000 | $139,600 |
| 2020 | $2,576 | $157,200 | $27,500 | $129,700 |
| 2019 | $2,376 | $157,200 | $27,500 | $129,700 |
| 2018 | $2,320 | $146,800 | $25,000 | $121,800 |
| 2017 | $2,252 | $146,800 | $25,000 | $121,800 |
| 2016 | $2,188 | $139,400 | $23,300 | $116,100 |
| 2015 | $2,188 | $139,400 | $23,300 | $116,100 |
| 2014 | $2,338 | $150,800 | $23,700 | $127,100 |
Source: Public Records
Map
Nearby Homes
- 4725 NE 27th Ct
- 4730 NE 27th Ct
- 2776 NE Norwood Ln
- 4763 NE 33rd Ct
- 4300 NE 27th St
- 4140 E 30th St
- 2519 E Aurora Ave
- 3512 NE 46th Ave
- 3103 E Shawnee Ave
- 4326 NE 35th St
- 4010 E 23rd St
- 4029 Colfax Ave
- 2822 Wedgewood Rd
- 2704 Wedgewood Rd
- 3500 E 32nd St
- 3001 E Ovid Ave
- 3315 E 25th St
- 2746 E Tiffin Ave
- 2722 E Tiffin Ave
- 2719 E Tiffin Ave
- 4670 NE 29th St
- 4645 NE 29th St
- 4635 NE 29th St
- 4631 NE 29th St
- 4665 NE 29th St
- 4675 NE 29th St
- 4655 NE 29th St
- 4625 NE 29th St
- 4695 NE 29th St
- 2850 NE 46th Ave
- 4700 NE 29th St
- 2920 NE 46th Ave
- 4689 NE 28th Ct
- 4645 NE 28th Ct
- 4665 NE 28th Ct
- 4705 NE 29th St
- 4671 NE 28th Ct
- 2830 NE 46th Ave
- 4706 NE 29th St
- 4675 NE 28th Ct