G
Seller's Agent in 2020
Greenbrier Homes Team
Meybohm
Estimated Value: $243,544 - $275,000
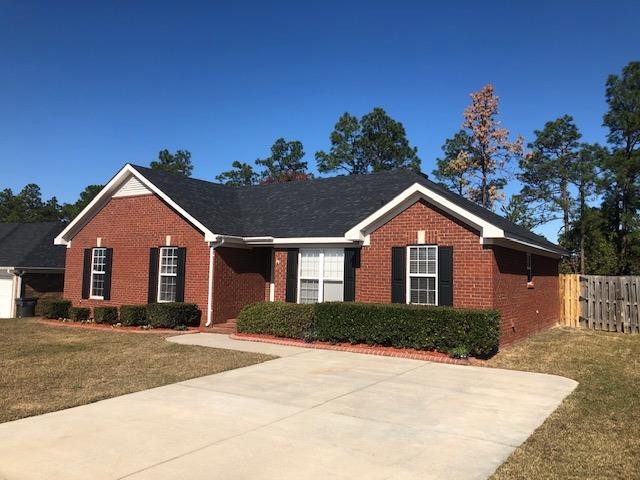
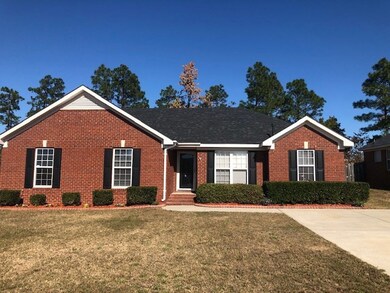
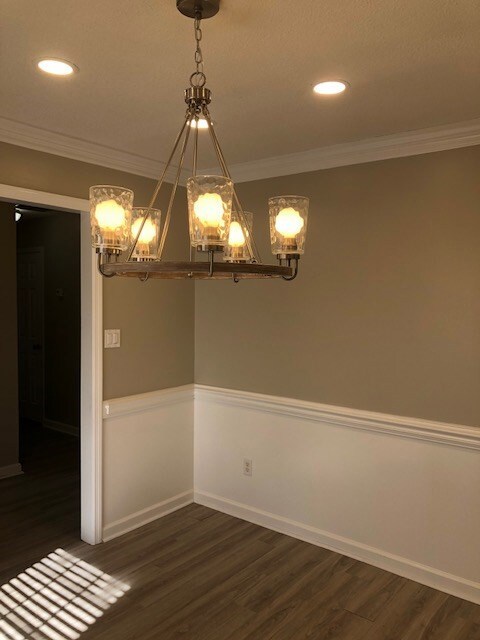
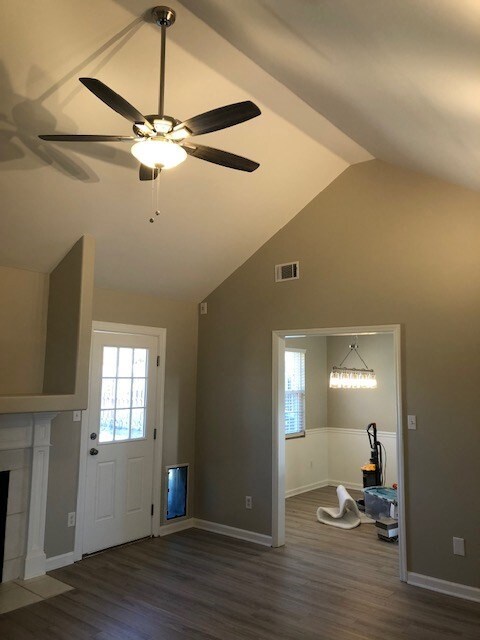
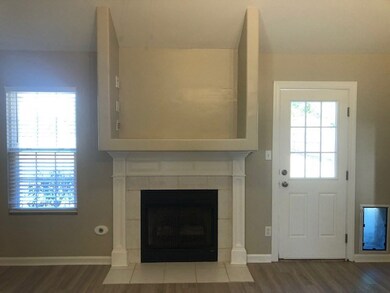
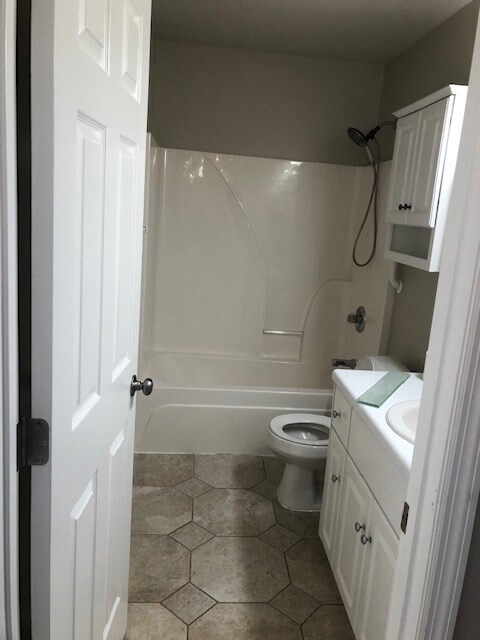
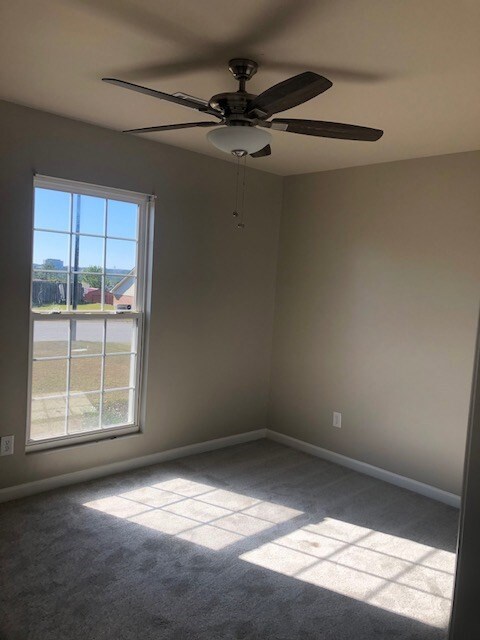
All brick ranch located in quiet family neighborhood just minutes from Gate 1. Home has been recently remodeled and is in move in condition!. Architectural roof only 3 years old, new wood look LVL wide plank flooring, freshly painted, new lighting fixtures, fans and updated door knobs throughout. Large privacy fenced backyard.Easy to show. Please schedule through Navica or contact one of our team for quick access.
Last Agent to Sell the Property
Greenbrier Homes Team
Meybohm Real Estate - Evans License #202239 Listed on: 11/13/2019
Last Buyer's Agent
Amy Cook
Meybohm Real Estate - Wheeler License #357940
| Date | Buyer | Sale Price | Title Company |
|---|---|---|---|
| Chance Sidney Price | $174,900 | -- | |
| Affordable Home Rentals Llc | -- | -- | |
| Zapata Randall P | $117,900 | -- |
| Date | Status | Borrower | Loan Amount |
|---|---|---|---|
| Open | Chance Sidney Price | $171,731 | |
| Previous Owner | Zapata Randall P | $120,493 |
| Date | Event | Price | List to Sale | Price per Sq Ft |
|---|---|---|---|---|
| 01/22/2020 01/22/20 | Sold | $174,900 | 0.0% | $107 / Sq Ft |
| 12/08/2019 12/08/19 | Pending | -- | -- | -- |
| 11/13/2019 11/13/19 | For Sale | $174,900 | -- | $107 / Sq Ft |
| Year | Tax Paid | Tax Assessment Tax Assessment Total Assessment is a certain percentage of the fair market value that is determined by local assessors to be the total taxable value of land and additions on the property. | Land | Improvement |
|---|---|---|---|---|
| 2025 | $2,842 | $88,284 | $12,800 | $75,484 |
| 2024 | $2,842 | $85,060 | $12,800 | $72,260 |
| 2023 | $2,678 | $82,504 | $12,800 | $69,704 |
| 2022 | $2,087 | $60,394 | $12,800 | $47,594 |
| 2021 | $2,053 | $53,912 | $12,800 | $41,112 |
| 2020 | $2,021 | $53,912 | $12,800 | $41,112 |
| 2019 | $1,966 | $48,549 | $12,800 | $35,749 |
| 2018 | $1,979 | $48,549 | $12,800 | $35,749 |
| 2017 | $1,934 | $48,549 | $12,800 | $35,749 |
| 2016 | $1,934 | $48,512 | $12,800 | $35,712 |
| 2015 | $1,784 | $48,512 | $12,800 | $35,712 |
| 2014 | -- | $48,252 | $12,800 | $35,452 |
G
Seller's Agent in 2020
Greenbrier Homes Team
Meybohm
A
Buyer's Agent in 2020
Amy Cook
Meybohm
Source: REALTORS® of Greater Augusta
MLS Number: 448779
APN: 0524011000
Disclaimer: Certain information contained herein is derived from information provided by parties other than Homes.com. All information provided is deemed reliable, but is not guaranteed to be accurate and should be independently verified.
![]() IDX information is provided exclusively for personal, non-commercial use, and may not be used for any purpose other than to identify prospective properties consumers may be interested in purchasing.
IDX information is provided exclusively for personal, non-commercial use, and may not be used for any purpose other than to identify prospective properties consumers may be interested in purchasing.
Information is deemed reliable but not guaranteed.