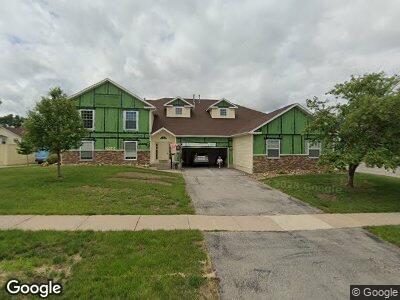
4655 Westchester Dr NE Cedar Rapids, IA 52402
Estimated Value: $171,000 - $191,000
2
Beds
2
Baths
1,550
Sq Ft
$116/Sq Ft
Est. Value
About This Home
This home is located at 4655 Westchester Dr NE, Cedar Rapids, IA 52402 and is currently estimated at $180,446, approximately $116 per square foot. 4655 Westchester Dr NE is a home located in Linn County with nearby schools including Pierce Elementary School, Franklin Middle School, and John F. Kennedy High School.
Ownership History
Date
Name
Owned For
Owner Type
Purchase Details
Closed on
Mar 28, 2022
Sold by
Edler John E and Edler Doris H
Bought by
Wagner Nancy K
Current Estimated Value
Purchase Details
Closed on
Dec 19, 2012
Sold by
Maxwell Carol D
Bought by
Edler John E and Edler Doris H
Home Financials for this Owner
Home Financials are based on the most recent Mortgage that was taken out on this home.
Original Mortgage
$12,250
Interest Rate
3.28%
Mortgage Type
Unknown
Purchase Details
Closed on
Apr 25, 2008
Sold by
Dostal Barbara Lee and Aune Barbara Lee
Bought by
Maxwell Carol D
Purchase Details
Closed on
Aug 24, 2001
Sold by
Aune Bruce Allen
Bought by
Aune Barbara Lee
Purchase Details
Closed on
Jul 17, 2001
Sold by
Harris Donald E and Harris Sharyn A
Bought by
Aune Barbara L
Create a Home Valuation Report for This Property
The Home Valuation Report is an in-depth analysis detailing your home's value as well as a comparison with similar homes in the area
Home Values in the Area
Average Home Value in this Area
Purchase History
| Date | Buyer | Sale Price | Title Company |
|---|---|---|---|
| Edler John E | $122,500 | None Available | |
| Maxwell Carol D | $117,500 | None Available | |
| Aune Barbara Lee | -- | -- | |
| Aune Barbara L | $113,500 | -- |
Source: Public Records
Mortgage History
| Date | Status | Borrower | Loan Amount |
|---|---|---|---|
| Closed | Edler Doris H | $12,250 | |
| Open | Edler John E | $98,000 | |
| Previous Owner | Dostal Barbara Lee | $110,494 |
Source: Public Records
Tax History Compared to Growth
Tax History
| Year | Tax Paid | Tax Assessment Tax Assessment Total Assessment is a certain percentage of the fair market value that is determined by local assessors to be the total taxable value of land and additions on the property. | Land | Improvement |
|---|---|---|---|---|
| 2023 | $2,926 | $163,200 | $23,000 | $140,200 |
| 2022 | $2,884 | $147,600 | $21,000 | $126,600 |
| 2021 | $3,042 | $139,200 | $19,000 | $120,200 |
| 2020 | $3,042 | $137,900 | $19,000 | $118,900 |
| 2019 | $2,616 | $121,400 | $19,000 | $102,400 |
| 2018 | $2,606 | $121,400 | $19,000 | $102,400 |
| 2017 | $2,506 | $122,400 | $14,000 | $108,400 |
| 2016 | $2,506 | $117,900 | $14,000 | $103,900 |
| 2015 | $2,622 | $123,181 | $14,000 | $109,181 |
| 2014 | $2,622 | $123,181 | $14,000 | $109,181 |
| 2013 | -- | $123,181 | $14,000 | $109,181 |
Source: Public Records
Map
Nearby Homes
- 4700 Coventry Ln NE
- 4430 Westchester Dr NE Unit D
- 3110 Towne House Dr NE Unit C
- 4625 White Pine Dr NE
- 4285 Westchester Dr NE Unit C
- 2333 Aspen Ln NE
- 4232 Twin Pine Dr NE
- 2204 Deb Ann Ln NE
- 3840 Wenig Rd NE
- 3181 Eagle Ct NE
- 3461 Oriole Ct NE
- 2205 Cherry Ln NE
- 2222 Evergreen St NE
- 4019 Summerfield Ln NE Unit D
- 3709 Spruce Wood Dr NE
- 3729 Wenig Rd NE
- 4111 Lexington Dr NE Unit D
- 3912 Summerfield Ln NE Unit C
- 3620 Coppermill Rd NE
- 3723 Old Orchard Rd NE
- 4655 Westchester Dr NE
- 4655 Westchester Dr NE
- 4655 Westchester Dr NE
- 4655 Westchester Dr NE Unit C
- 4655 Westchester Dr NE Unit A
- 4655 Westchester Dr NE Unit D
- 4705 Westchester Dr NE Unit C
- 4705 Westchester Dr NE
- 4705 Westchester Dr NE
- 4705 Westchester Dr NE
- 4705 Westchester Dr NE Unit B
- 4645 Westchester Dr NE
- 4645 Westchester Dr NE
- 4645 Westchester Dr NE
- 4645 Westchester Dr NE Unit B
- 4605 Westchester Dr NE Unit C
- 4605 Westchester Dr NE
- 4605 Westchester Dr NE
- 4605 Westchester Dr NE Unit D
- 4610 Westchester Dr NE Unit C