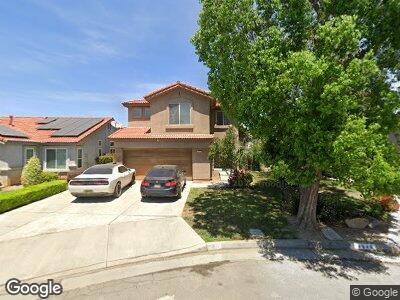
4656 W Weldon Ave Fresno, CA 93722
West Fresno NeighborhoodEstimated Value: $373,000 - $407,000
3
Beds
3
Baths
1,828
Sq Ft
$214/Sq Ft
Est. Value
About This Home
This home is located at 4656 W Weldon Ave, Fresno, CA 93722 and is currently estimated at $391,414, approximately $214 per square foot. 4656 W Weldon Ave is a home located in Fresno County with nearby schools including McKinley Elementary School, El Capitan Middle School, and Central East High School.
Ownership History
Date
Name
Owned For
Owner Type
Purchase Details
Closed on
Sep 14, 2017
Sold by
Dhaliwal Rajbinder Singh and Dhaliwal Bhupinder K
Bought by
Singh Rajbinder
Current Estimated Value
Purchase Details
Closed on
Jul 2, 1999
Sold by
Hud
Bought by
Dhaliwal Rajbinder Singh and Dhaliwal Bhupinder K
Home Financials for this Owner
Home Financials are based on the most recent Mortgage that was taken out on this home.
Original Mortgage
$103,259
Interest Rate
7.24%
Mortgage Type
FHA
Purchase Details
Closed on
Oct 20, 1998
Sold by
California Housing Finance Agency
Bought by
Hud
Purchase Details
Closed on
Nov 7, 1997
Sold by
Almonte Aileen F and Almonte Rogelio V
Bought by
Almonte Rogelio V and Almonte Tessie F
Purchase Details
Closed on
Dec 22, 1994
Sold by
Trend Homes Inc
Bought by
Almonte Rogelio V and Almonte Tessie F
Home Financials for this Owner
Home Financials are based on the most recent Mortgage that was taken out on this home.
Original Mortgage
$112,475
Interest Rate
9.25%
Mortgage Type
FHA
Create a Home Valuation Report for This Property
The Home Valuation Report is an in-depth analysis detailing your home's value as well as a comparison with similar homes in the area
Home Values in the Area
Average Home Value in this Area
Purchase History
| Date | Buyer | Sale Price | Title Company |
|---|---|---|---|
| Singh Rajbinder | -- | None Available | |
| Dhaliwal Rajbinder Singh | $101,500 | North American Title Co | |
| Hud | -- | -- | |
| California Housing Finance Agency | $121,724 | -- | |
| Almonte Rogelio V | -- | -- | |
| Almonte Rogelio V | -- | -- | |
| Almonte Rogelio V | $114,000 | Stewart Title |
Source: Public Records
Mortgage History
| Date | Status | Borrower | Loan Amount |
|---|---|---|---|
| Previous Owner | Dhaliwal Rajbinder Singh | $75,000 | |
| Previous Owner | Dhaliwal Rajbinder Singh | $50,000 | |
| Previous Owner | Dhaliwal Rajbinder Singh | $85,000 | |
| Previous Owner | Dhaliwal Rajbinder Singh | $103,259 | |
| Previous Owner | Almonte Rogelio V | $112,475 |
Source: Public Records
Tax History Compared to Growth
Tax History
| Year | Tax Paid | Tax Assessment Tax Assessment Total Assessment is a certain percentage of the fair market value that is determined by local assessors to be the total taxable value of land and additions on the property. | Land | Improvement |
|---|---|---|---|---|
| 2023 | $1,919 | $149,186 | $36,922 | $112,264 |
| 2022 | $1,811 | $146,262 | $36,199 | $110,063 |
| 2021 | $1,825 | $143,395 | $35,490 | $107,905 |
| 2020 | $1,736 | $141,926 | $35,127 | $106,799 |
| 2019 | $1,710 | $139,144 | $34,439 | $104,705 |
| 2018 | $1,670 | $136,416 | $33,764 | $102,652 |
| 2017 | $1,590 | $133,742 | $33,102 | $100,640 |
| 2016 | $1,464 | $131,120 | $32,453 | $98,667 |
| 2015 | $1,456 | $129,151 | $31,966 | $97,185 |
| 2014 | $1,454 | $126,622 | $31,340 | $95,282 |
Source: Public Records
Map
Nearby Homes
- 2393 N Blythe Ave
- 2437 N Tracy Ave
- 4688 W Harvard Ave
- 5167 W Clinton Ave
- 2545 N Cecelia Ave
- 1656 N Cecelia Ave
- 4223 W Yale Ave
- 4327 W Brown Ave
- 2670 N Katy Ave
- 5164 W Michigan Ave
- 5049 W Lamona Ave
- 2413 N Sonora Ave
- 4765 W Shields Ave
- 1697 N State St
- 5396 W Pine Ave
- 5239 N Dante
- 5244 W Fern Ave
- 1637 N State St
- 1628 N Delbert Ave
- 5611 W Carmen Ave
- 4656 W Weldon Ave
- 4664 W Weldon Ave
- 4648 W Weldon Ave
- 4659 W Cambridge Ave
- 4672 W Weldon Ave
- 4651 W Cambridge Ave
- 4667 W Cambridge Ave
- 4644 W Weldon Ave
- 4643 W Cambridge Ave
- 4675 W Cambridge Ave
- 4680 W Weldon Ave
- 4637 W Cambridge Ave
- 4683 W Cambridge Ave
- 4645 W Weldon Ave
- 4688 W Weldon Ave
- 4631 W Cambridge Ave
- 2223 N Antioch Ave
- 2215 N Antioch Ave
- 4657 W Weldon Ave
- 4691 W Cambridge Ave