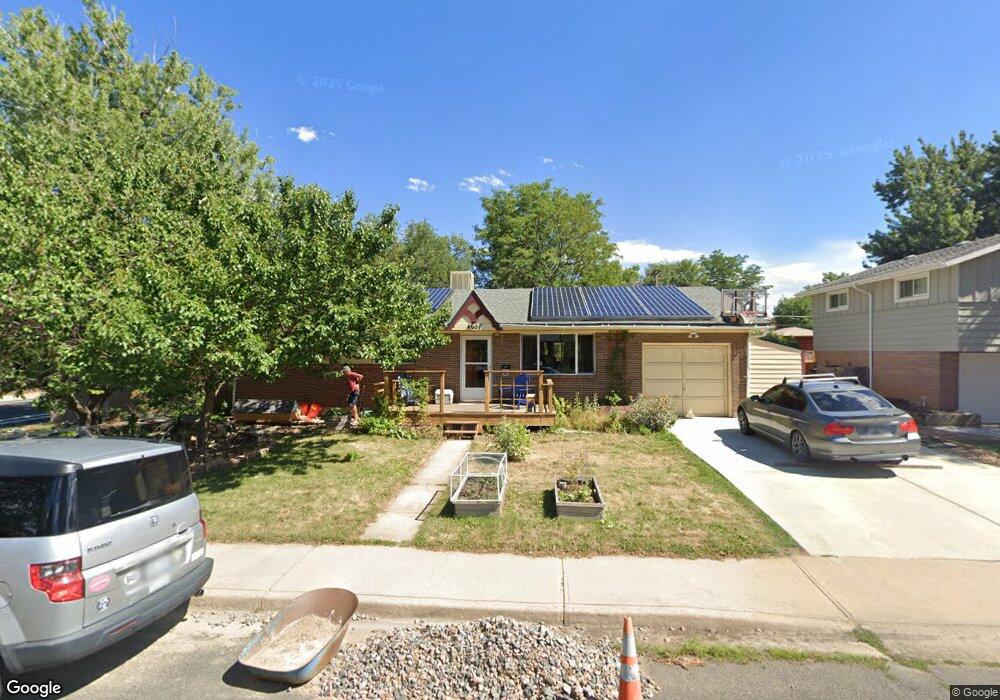
4657 Ingram Ct Boulder, CO 80305
South Boulder NeighborhoodEstimated Value: $772,000 - $877,000
3
Beds
2
Baths
1,341
Sq Ft
$614/Sq Ft
Est. Value
About This Home
This home is located at 4657 Ingram Ct, Boulder, CO 80305 and is currently estimated at $823,745, approximately $614 per square foot. 4657 Ingram Ct is a home located in Boulder County with nearby schools including Creekside Elementary School, Manhattan Middle School of the Arts & Academics, and Fairview High School.
Ownership History
Date
Name
Owned For
Owner Type
Purchase Details
Closed on
Aug 15, 1997
Sold by
Hudak David
Bought by
Leader Kelly B
Current Estimated Value
Home Financials for this Owner
Home Financials are based on the most recent Mortgage that was taken out on this home.
Original Mortgage
$120,000
Outstanding Balance
$18,082
Interest Rate
7.6%
Estimated Equity
$805,663
Purchase Details
Closed on
Jun 1, 1992
Bought by
Johnson Kelly L and Johnson James S
Purchase Details
Closed on
Jun 22, 1979
Bought by
Johnson Kelly L and Johnson James S
Create a Home Valuation Report for This Property
The Home Valuation Report is an in-depth analysis detailing your home's value as well as a comparison with similar homes in the area
Home Values in the Area
Average Home Value in this Area
Purchase History
| Date | Buyer | Sale Price | Title Company |
|---|---|---|---|
| Leader Kelly B | $181,000 | -- | |
| Johnson Kelly L | $135,000 | -- | |
| Johnson Kelly L | $69,500 | -- |
Source: Public Records
Mortgage History
| Date | Status | Borrower | Loan Amount |
|---|---|---|---|
| Open | Leader Kelly B | $120,000 |
Source: Public Records
Tax History
| Year | Tax Paid | Tax Assessment Tax Assessment Total Assessment is a certain percentage of the fair market value that is determined by local assessors to be the total taxable value of land and additions on the property. | Land | Improvement |
|---|---|---|---|---|
| 2025 | $4,548 | $46,450 | $32,081 | $14,369 |
| 2024 | $4,469 | $51,751 | $35,503 | $16,248 |
| 2023 | $4,469 | $51,751 | $39,188 | $16,248 |
| 2022 | $4,044 | $43,549 | $29,218 | $14,331 |
| 2021 | $3,856 | $44,802 | $30,059 | $14,743 |
| 2020 | $3,721 | $42,743 | $23,953 | $18,790 |
| 2019 | $3,664 | $42,743 | $23,953 | $18,790 |
| 2018 | $3,414 | $39,377 | $22,104 | $17,273 |
| 2017 | $3,307 | $43,533 | $24,437 | $19,096 |
| 2016 | $3,119 | $36,027 | $15,602 | $20,425 |
| 2015 | $2,953 | $28,529 | $13,134 | $15,395 |
| 2014 | $2,399 | $28,529 | $13,134 | $15,395 |
Source: Public Records
Map
Nearby Homes
- 4835 Moorhead Ave
- 4595 Moorhead Ave
- 4453 Hamilton Ct
- 15 Pawnee Dr
- 4521 Navajo Place
- 405 S 43rd St
- 4800 Osage Dr Unit B-16
- 4763 Tantra Dr Unit B
- 230 Pawnee Dr
- 755 W Moorhead Cir Unit B
- 750 W Moorhead Cir Unit A
- 725 S 45th St
- 800 W Moorhead Cir Unit E
- 860 W Moorhead Cir Unit 1I
- 860 W Moorhead Cir Unit 2H
- 375 S 40th St
- 3805 Martin Dr
- 130 Cherokee Way
- 265 S 39th St
- 167 Cherokee Way
- 4661 Ingram Ct
- 4691 Ingram Ct
- 4687 Ingram Ct
- 4665 Ingram Ct
- 4654 Ingram Ct
- 4656 Ingram Ct
- 4683 Ingram Ct
- 4735 Moorhead Ave
- 4705 Moorhead Ave
- 4765 Moorhead Ave
- 4695 Moorhead Ave
- 4795 Moorhead Ave
- 4669 Ingram Ct
- 4665 Moorhead Ave
- 4679 Ingram Ct
- 4662 Ingram Ct
- 4494 Hamilton Ct
- 4694 Ingram Ct
- 4492 Hamilton Ct
- 4692 Ingram Ct
Your Personal Tour Guide
Ask me questions while you tour the home.