Estimated Value: $804,000 - $900,688
3
Beds
2
Baths
2,140
Sq Ft
$406/Sq Ft
Est. Value
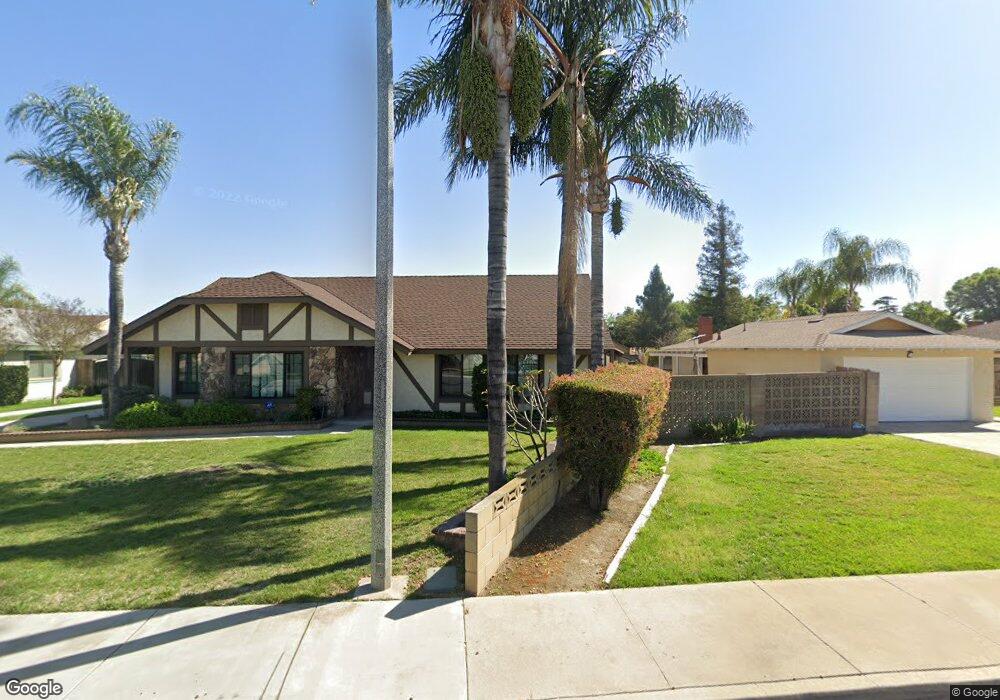
About This Home
This home is located at 4657 Terry Ave, Chino, CA 91710 and is currently estimated at $869,172, approximately $406 per square foot. 4657 Terry Ave is a home located in San Bernardino County with nearby schools including Newman Elementary, Ramona Junior High School, and Don Antonio Lugo High School.
Ownership History
Date
Name
Owned For
Owner Type
Purchase Details
Closed on
Feb 27, 2003
Sold by
Maggard Tim and Maggard Sandra
Bought by
Esseling Benny and Esseling Denise Lynn
Current Estimated Value
Home Financials for this Owner
Home Financials are based on the most recent Mortgage that was taken out on this home.
Original Mortgage
$185,000
Interest Rate
5.84%
Purchase Details
Closed on
Jan 23, 1997
Sold by
Perryman David C
Bought by
Maggard Tim and Maggard Sandra
Home Financials for this Owner
Home Financials are based on the most recent Mortgage that was taken out on this home.
Original Mortgage
$168,300
Interest Rate
7.9%
Mortgage Type
VA
Purchase Details
Closed on
Mar 18, 1994
Sold by
Perryman Kathleen S
Bought by
Perryman David C
Home Financials for this Owner
Home Financials are based on the most recent Mortgage that was taken out on this home.
Original Mortgage
$150,000
Interest Rate
7.21%
Create a Home Valuation Report for This Property
The Home Valuation Report is an in-depth analysis detailing your home's value as well as a comparison with similar homes in the area
Home Values in the Area
Average Home Value in this Area
Purchase History
| Date | Buyer | Sale Price | Title Company |
|---|---|---|---|
| Esseling Benny | $385,000 | Fidelity National Title | |
| Maggard Tim | $179,000 | Chicago Title Co | |
| Perryman David C | -- | Northern Counties Title |
Source: Public Records
Mortgage History
| Date | Status | Borrower | Loan Amount |
|---|---|---|---|
| Previous Owner | Esseling Benny | $185,000 | |
| Previous Owner | Maggard Tim | $168,300 | |
| Previous Owner | Perryman David C | $150,000 |
Source: Public Records
Tax History
| Year | Tax Paid | Tax Assessment Tax Assessment Total Assessment is a certain percentage of the fair market value that is determined by local assessors to be the total taxable value of land and additions on the property. | Land | Improvement |
|---|---|---|---|---|
| 2025 | $6,330 | $574,932 | $144,835 | $430,097 |
| 2024 | $6,160 | $563,659 | $141,995 | $421,664 |
| 2023 | $5,988 | $552,607 | $139,211 | $413,396 |
| 2022 | $5,951 | $541,771 | $136,481 | $405,290 |
| 2021 | $5,656 | $515,151 | $133,806 | $381,345 |
| 2020 | $5,582 | $509,869 | $132,434 | $377,435 |
| 2019 | $5,483 | $499,871 | $129,837 | $370,034 |
| 2018 | $5,361 | $490,069 | $127,291 | $362,778 |
| 2017 | $5,264 | $480,460 | $124,795 | $355,665 |
| 2016 | $4,917 | $471,039 | $122,348 | $348,691 |
| 2015 | $4,817 | $463,963 | $120,510 | $343,453 |
| 2014 | $4,720 | $454,874 | $118,149 | $336,725 |
Source: Public Records
Map
Nearby Homes
- 4836 Terry Ave
- 12585 Yorba Ave
- 12488 Monte Vista Ave
- 12620 Anthony Place
- 12629 Thomas Place
- 12608 Ramona Ave
- 4610 Philadelphia St
- 5039 Tyler St
- 11938 Vista Ave
- 12124 Lester Ct
- 4400 Philadelphia St Unit 71
- 4965 Independence St
- 5195 Walnut Ave Unit 14
- 11818 Yorba Ave
- 11814 Ramona Ave
- 11795 Crystal Ave
- 4043 Olive St
- 11748 Monte Vista Ave
- 13065 San Clemente Ln
- 12931 4th St
- 4647 Terry Ave
- 4677 Terry Ave
- 4637 Terry Ave
- 12438 Yorba Ave
- 4627 Terry Ave
- 12420 Yorba Ave
- 12406 Yorba Ave
- 12432 Yorba Ave
- 4660 Terry Ave
- 4670 Terry Ave
- 4640 Terry Ave
- 4617 Terry Ave
- 4680 Terry Ave
- 4630 Terry Ave
- 12444 Yorba Ave
- 4690 Terry Ave
- 12371 Brown Ct
- 4607 Terry Ave
- 4620 Terry Ave
- 12372 Brown Ct
Your Personal Tour Guide
Ask me questions while you tour the home.