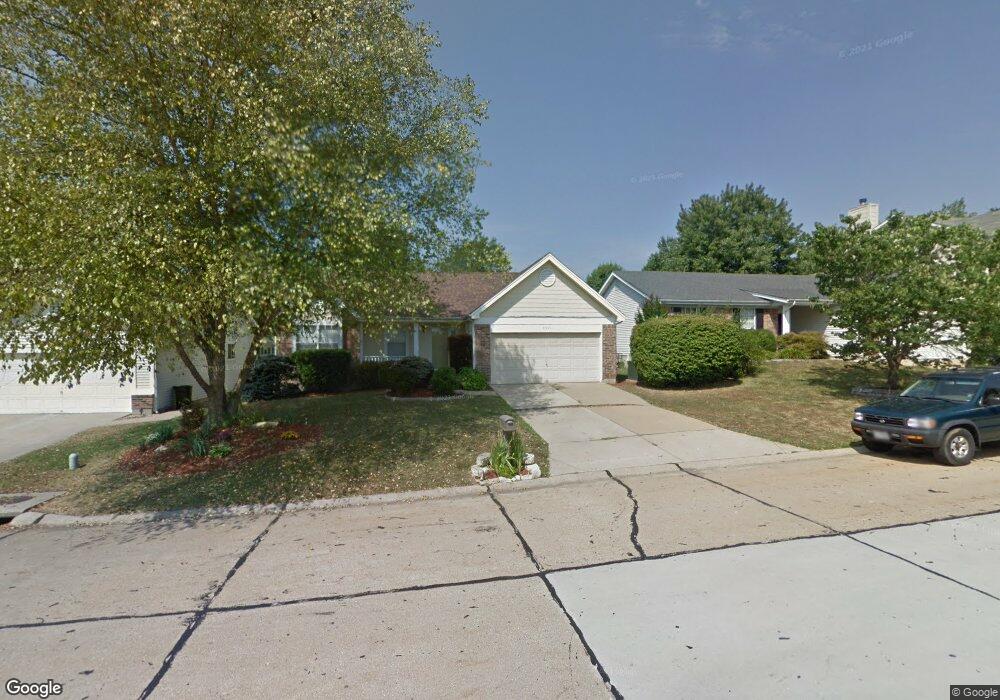
4659 Meramec Blvd Eureka, MO 63025
Estimated Value: $340,940 - $364,000
4
Beds
3
Baths
1,468
Sq Ft
$243/Sq Ft
Est. Value
About This Home
This home is located at 4659 Meramec Blvd, Eureka, MO 63025 and is currently estimated at $356,485, approximately $242 per square foot. 4659 Meramec Blvd is a home located in St. Louis County with nearby schools including Blevins Elementary School, Lasalle Springs Middle School, and Eureka Senior High School.
Ownership History
Date
Name
Owned For
Owner Type
Purchase Details
Closed on
Oct 1, 2018
Sold by
Dunham Chad and Dunham Katrina C
Bought by
Dunham Chad and Dunham Katrina C
Current Estimated Value
Home Financials for this Owner
Home Financials are based on the most recent Mortgage that was taken out on this home.
Original Mortgage
$50,000
Outstanding Balance
$31,055
Interest Rate
4.5%
Mortgage Type
Credit Line Revolving
Estimated Equity
$325,430
Purchase Details
Closed on
Jan 30, 2010
Sold by
Dunham Chad
Bought by
Dunham Chad and Lewis Katrina
Home Financials for this Owner
Home Financials are based on the most recent Mortgage that was taken out on this home.
Original Mortgage
$175,531
Outstanding Balance
$114,366
Interest Rate
4.8%
Mortgage Type
FHA
Estimated Equity
$242,119
Purchase Details
Closed on
Jan 4, 2010
Sold by
Haggin Harry M and Haggin Deborah A
Bought by
Dunham Chad
Home Financials for this Owner
Home Financials are based on the most recent Mortgage that was taken out on this home.
Original Mortgage
$175,531
Outstanding Balance
$114,366
Interest Rate
4.8%
Mortgage Type
FHA
Estimated Equity
$242,119
Create a Home Valuation Report for This Property
The Home Valuation Report is an in-depth analysis detailing your home's value as well as a comparison with similar homes in the area
Home Values in the Area
Average Home Value in this Area
Purchase History
| Date | Buyer | Sale Price | Title Company |
|---|---|---|---|
| Dunham Chad | -- | Touchstone Title & Abstract | |
| Dunham Chad | -- | None Available | |
| Dunham Chad | $178,770 | Title Partners Agency Llc |
Source: Public Records
Mortgage History
| Date | Status | Borrower | Loan Amount |
|---|---|---|---|
| Open | Dunham Chad | $50,000 | |
| Open | Dunham Chad | $175,531 |
Source: Public Records
Tax History
| Year | Tax Paid | Tax Assessment Tax Assessment Total Assessment is a certain percentage of the fair market value that is determined by local assessors to be the total taxable value of land and additions on the property. | Land | Improvement |
|---|---|---|---|---|
| 2025 | $4,097 | $63,270 | $18,160 | $45,110 |
| 2024 | $4,097 | $54,880 | $14,120 | $40,760 |
| 2023 | $4,101 | $54,880 | $14,120 | $40,760 |
| 2022 | $3,921 | $48,830 | $15,140 | $33,690 |
| 2021 | $3,893 | $48,830 | $15,140 | $33,690 |
| 2020 | $3,691 | $44,270 | $12,650 | $31,620 |
| 2019 | $3,702 | $44,270 | $12,650 | $31,620 |
| 2018 | $3,366 | $37,980 | $7,830 | $30,150 |
| 2016 | $3,059 | $34,450 | $5,870 | $28,580 |
Source: Public Records
Map
Nearby Homes
- 17134 Elm Trail Dr
- 17114 Elm Trail Dr
- 4606 Hickory Ridge View Ct
- 944 Emerald Oaks Ct
- 16 Rockwood Forest Glen
- 17347 Hilltop Ridge Dr
- 897 Top Notch Ln
- 15 Rockwood Place Ct
- 744 Forby Rd
- 17457 Wyman Ridge Dr
- 160 Hunters Run Ct
- 132 Hunters Green Ln
- 637 N Virginia Ave
- 0 Unknown Unit MIS26004384
- 17472 Thunder Valley Dr
- 17498 Wyman Ridge Dr
- 3 Leona Ln
- 17513 Wyman Ridge Dr
- 5315 Shawnee View Ct
- 756 Brewster Rd
- 4663 Meramec Blvd
- 4655 Meramec Blvd
- 4651 Meramec Blvd
- 4654 Hickory Ridge View Ct
- 4650 Hickory Ridge View Ct
- 4658 Hickory Ridge View Ct
- 4646 Hickory Ridge View Ct
- 4671 Meramec Blvd
- 4647 Meramec Blvd
- 17050 Redwood Glen Dr
- 4662 Hickory Ridge View Ct
- 4642 Hickory Ridge View Ct
- 17043 Redwood Glen Dr
- 4643 Meramec Blvd
- 17046 Redwood Glen Dr
- 17018 Ashwood Trail Ct
- 4675 Meramec Blvd
- 17033 Elm Trail Dr
- 4657 Hickory Ridge View Ct
- 4638 Hickory Ridge View Ct
Your Personal Tour Guide
Ask me questions while you tour the home.