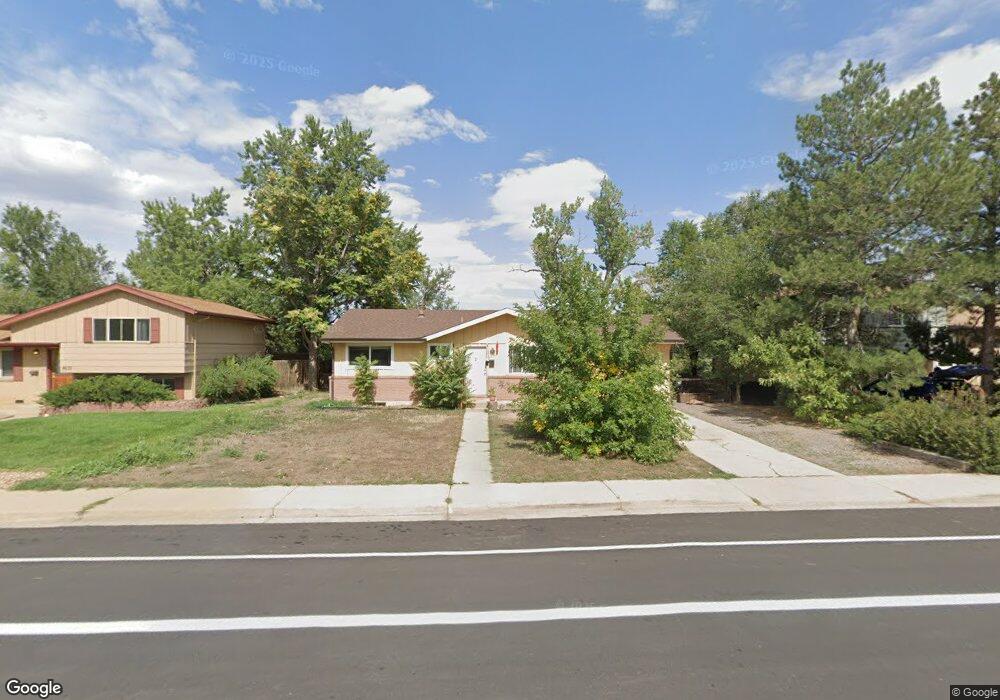
4665 Moorhead Ave Boulder, CO 80305
South Boulder NeighborhoodEstimated Value: $704,856 - $786,000
3
Beds
1
Bath
1,203
Sq Ft
$617/Sq Ft
Est. Value
About This Home
This home is located at 4665 Moorhead Ave, Boulder, CO 80305 and is currently estimated at $741,714, approximately $616 per square foot. 4665 Moorhead Ave is a home located in Boulder County with nearby schools including Creekside Elementary School, Manhattan Middle School of the Arts & Academics, and Fairview High School.
Ownership History
Date
Name
Owned For
Owner Type
Purchase Details
Closed on
Oct 28, 2013
Sold by
Mayers Nicholas J
Bought by
Mayers Nicholas J
Current Estimated Value
Home Financials for this Owner
Home Financials are based on the most recent Mortgage that was taken out on this home.
Original Mortgage
$259,978
Outstanding Balance
$133,858
Interest Rate
4.37%
Mortgage Type
New Conventional
Estimated Equity
$607,856
Purchase Details
Closed on
Feb 29, 2008
Sold by
Mayers Nicholas J
Bought by
Mayers Nicholas J
Purchase Details
Closed on
Sep 25, 2007
Sold by
Jensen Tharpa C
Bought by
Mayers Nicholas J
Home Financials for this Owner
Home Financials are based on the most recent Mortgage that was taken out on this home.
Original Mortgage
$277,200
Interest Rate
6.48%
Mortgage Type
Purchase Money Mortgage
Purchase Details
Closed on
Aug 24, 1993
Bought by
Mayers Nicholas J and Mayers Regis S
Purchase Details
Closed on
Oct 6, 1976
Bought by
Mayers Nicholas J and Mayers Regis S
Create a Home Valuation Report for This Property
The Home Valuation Report is an in-depth analysis detailing your home's value as well as a comparison with similar homes in the area
Home Values in the Area
Average Home Value in this Area
Purchase History
| Date | Buyer | Sale Price | Title Company |
|---|---|---|---|
| Mayers Nicholas J | -- | Guardian Title Agency Llc | |
| Mayers Nicholas J | -- | None Available | |
| Mayers Nicholas J | $308,000 | Guardian Title Agency Llc | |
| Mayers Nicholas J | -- | -- | |
| Mayers Nicholas J | $38,500 | -- |
Source: Public Records
Mortgage History
| Date | Status | Borrower | Loan Amount |
|---|---|---|---|
| Open | Mayers Nicholas J | $259,978 | |
| Closed | Mayers Nicholas J | $277,200 |
Source: Public Records
Tax History
| Year | Tax Paid | Tax Assessment Tax Assessment Total Assessment is a certain percentage of the fair market value that is determined by local assessors to be the total taxable value of land and additions on the property. | Land | Improvement |
|---|---|---|---|---|
| 2025 | $4,036 | $41,313 | $31,713 | $9,600 |
| 2024 | $4,036 | $41,313 | $31,713 | $9,600 |
| 2023 | $3,963 | $45,024 | $38,083 | $10,626 |
| 2022 | $3,632 | $38,301 | $28,356 | $9,945 |
| 2021 | $3,467 | $39,404 | $29,172 | $10,232 |
| 2020 | $3,261 | $37,466 | $23,309 | $14,157 |
| 2019 | $3,211 | $37,466 | $23,309 | $14,157 |
| 2018 | $2,762 | $31,853 | $19,944 | $11,909 |
| 2017 | $2,675 | $35,215 | $22,049 | $13,166 |
| 2016 | $2,657 | $30,694 | $14,965 | $15,729 |
| 2015 | $2,516 | $24,557 | $10,826 | $13,731 |
| 2014 | $2,065 | $24,557 | $10,826 | $13,731 |
Source: Public Records
Map
Nearby Homes
- 4595 Moorhead Ave
- 4453 Hamilton Ct
- 4835 Moorhead Ave
- 4800 Osage Dr Unit B-16
- 4763 Tantra Dr Unit B
- 450 S 41st St
- 210 S 39th St
- 750 W Moorhead Cir Unit A
- 725 S 45th St
- 3805 Martin Dr
- 800 W Moorhead Cir Unit E
- 167 Cherokee Way
- 860 W Moorhead Cir Unit 2K
- 860 W Moorhead Cir Unit 1I
- 860 W Moorhead Cir Unit 2H
- 345 S 38th St
- 33 S Boulder Cir Unit 316
- 33 S Boulder Cir Unit 306
- 20 S Boulder Cir Unit 20-2204
- 20 S Boulder Cir Unit 2312
- 4635 Moorhead Ave
- 4695 Moorhead Ave
- 4605 Moorhead Ave
- 4705 Moorhead Ave
- 4654 Ingram Ct
- 4494 Hamilton Ct
- 4735 Moorhead Ave
- 4656 Ingram Ct
- 4657 Ingram Ct
- 4565 Moorhead Ave
- 4492 Hamilton Ct
- 4765 Moorhead Ave
- 4661 Ingram Ct
- 4535 Moorhead Ave
- 4488 Hamilton Ct
- 4691 Ingram Ct
- 4795 Moorhead Ave
- 4489 Hamilton Ct
- 4665 Ingram Ct
- 4687 Ingram Ct
Your Personal Tour Guide
Ask me questions while you tour the home.