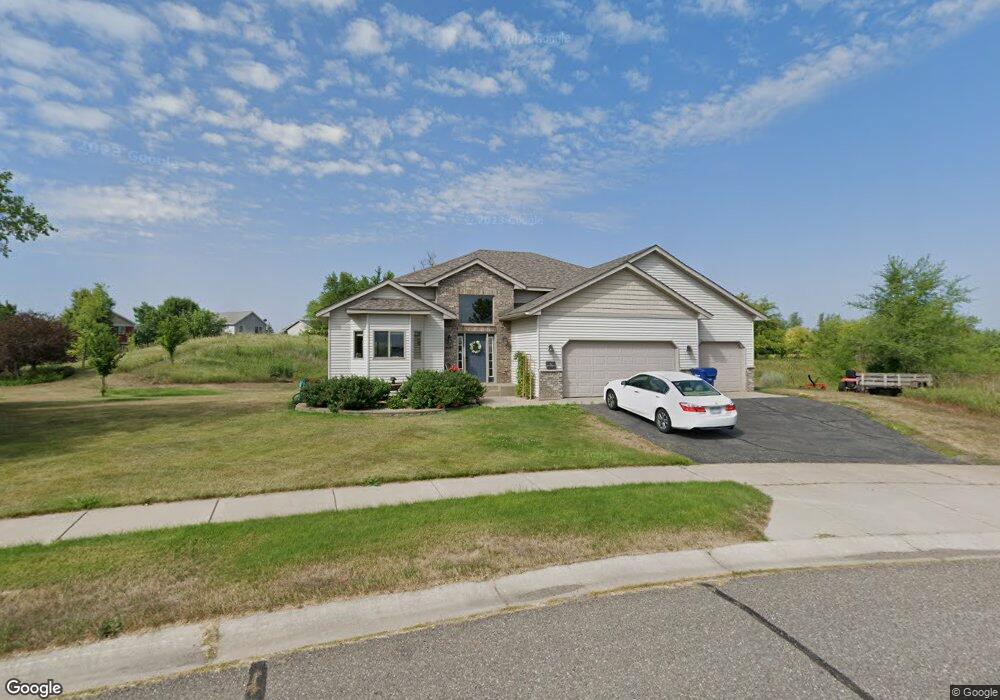
4667 4667 3rd Street Loop NE St. Cloud, MN 56304
Estimated Value: $333,035 - $379,000
3
Beds
3
Baths
--
Sq Ft
--
Built
About This Home
This home is located at 4667 4667 3rd Street Loop NE, St. Cloud, MN 56304 and is currently estimated at $354,009. 4667 4667 3rd Street Loop NE is a home located in Benton County with nearby schools including Mississippi Heights Elementary School, Sauk Rapids-Rice Middle School, and Sauk Rapids-Rice Senior High School.
Ownership History
Date
Name
Owned For
Owner Type
Purchase Details
Closed on
Sep 13, 2011
Sold by
Jpmorgan Chase Bank Na
Bought by
Behrens Tyler and Behrens Sarah
Current Estimated Value
Home Financials for this Owner
Home Financials are based on the most recent Mortgage that was taken out on this home.
Original Mortgage
$151,557
Outstanding Balance
$103,636
Interest Rate
4.23%
Mortgage Type
FHA
Estimated Equity
$250,373
Purchase Details
Closed on
Apr 28, 2006
Sold by
Cutting Edge Homes Inc
Bought by
Mertens Jason
Purchase Details
Closed on
Mar 30, 2005
Sold by
Water S Edge Development Llc
Bought by
Cutting Edge Homes Inc
Home Financials for this Owner
Home Financials are based on the most recent Mortgage that was taken out on this home.
Original Mortgage
$150,800
Interest Rate
5.71%
Mortgage Type
Construction
Create a Home Valuation Report for This Property
The Home Valuation Report is an in-depth analysis detailing your home's value as well as a comparison with similar homes in the area
Home Values in the Area
Average Home Value in this Area
Purchase History
| Date | Buyer | Sale Price | Title Company |
|---|---|---|---|
| Behrens Tyler | $155,500 | None Available | |
| Mertens Jason | -- | -- | |
| Cutting Edge Homes Inc | $50,000 | None Available |
Source: Public Records
Mortgage History
| Date | Status | Borrower | Loan Amount |
|---|---|---|---|
| Open | Behrens Tyler | $151,557 | |
| Previous Owner | Cutting Edge Homes Inc | $150,800 |
Source: Public Records
Tax History Compared to Growth
Tax History
| Year | Tax Paid | Tax Assessment Tax Assessment Total Assessment is a certain percentage of the fair market value that is determined by local assessors to be the total taxable value of land and additions on the property. | Land | Improvement |
|---|---|---|---|---|
| 2025 | $3,500 | $269,900 | $50,000 | $219,900 |
| 2024 | $3,532 | $259,400 | $50,000 | $209,400 |
| 2023 | $3,266 | $259,400 | $50,000 | $209,400 |
| 2022 | $2,878 | $230,500 | $50,000 | $180,500 |
| 2021 | $2,736 | $194,400 | $50,000 | $144,400 |
| 2018 | $2,348 | $157,800 | $39,693 | $118,107 |
| 2017 | $2,348 | $136,000 | $29,956 | $106,044 |
| 2016 | $2,364 | $153,000 | $35,000 | $118,000 |
| 2015 | $2,422 | $126,500 | $29,477 | $97,023 |
| 2014 | -- | $118,000 | $24,860 | $93,140 |
| 2013 | -- | $118,000 | $24,860 | $93,140 |
Source: Public Records
Map
Nearby Homes
- 4695 3rd Street Loop NE
- 655 47th Ave NE
- 4732 4th Street Loop NE
- 610 47th Ave NE
- 606 47th Ave NE
- 602 47th Ave NE
- 614 47th Ave NE
- The Mulberry Plan at Waters Edge - Liberty
- The Waverly Plan at Waters Edge - Liberty
- The Newport Plan at Waters Edge - Liberty
- The Newport Plan at Waters Edge
- The Rockport Plan at Waters Edge
- The Ashton Plan at Waters Edge - Liberty
- The Mulberry Plan at Waters Edge
- The Cheyenne Plan at Waters Edge - Liberty
- The Primrose Plan at Waters Edge - Liberty
- The Primrose Plan at Waters Edge
- The Rockport Plan at Waters Edge - Liberty
- The Ashton Plan at Waters Edge
- The Cheyenne Plan at Waters Edge
- 4667 3rd Street Loop NE
- 4671 3rd Street Loop NE
- 4697 1st St NE
- 4702 2nd Street Ct NE
- 4675 3rd Street Loop NE
- 4703 2nd St NE
- 4706 2nd Street Ct NE
- 4689 1st St NE
- 4689 1st St NE
- 4710 2nd Street Ct NE
- 301 47th Ave NE
- 4685 1st St NE
- 4685 1st St NE
- 4679 3rd Street Loop NE
- 4714 4714 2nd Street Ct NE
- 4714 2nd Street Ct NE
- 4734 2nd St NE
- 4735 2nd-Street-se
- 4735 2nd-Street-ne
- 4735 2nd St NE