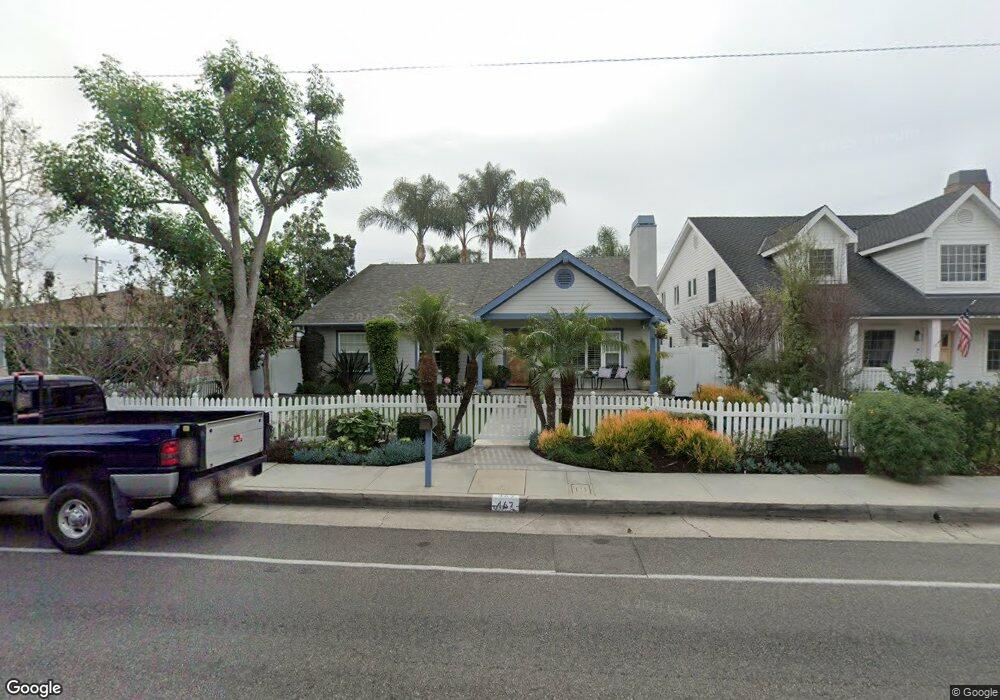
467 E 19th St Costa Mesa, CA 92627
Downtown Costa Mesa NeighborhoodEstimated Value: $2,670,835 - $2,932,000
4
Beds
2
Baths
2,188
Sq Ft
$1,273/Sq Ft
Est. Value
About This Home
This home is located at 467 E 19th St, Costa Mesa, CA 92627 and is currently estimated at $2,784,709, approximately $1,272 per square foot. 467 E 19th St is a home located in Orange County with nearby schools including Mariners Elementary School, Horace Ensign Intermediate School, and Newport Harbor High School.
Ownership History
Date
Name
Owned For
Owner Type
Purchase Details
Closed on
Apr 21, 2022
Sold by
Hanson and Tracy
Bought by
Keith And Tracy Hanson Living Trust
Current Estimated Value
Purchase Details
Closed on
Apr 17, 2003
Sold by
Hanson Frans Richard and Hanson Ida Mae
Bought by
Hanson Keith and Hanson Tracy
Home Financials for this Owner
Home Financials are based on the most recent Mortgage that was taken out on this home.
Original Mortgage
$250,000
Interest Rate
5.72%
Purchase Details
Closed on
Feb 1, 2000
Sold by
Hanson Frans R and Hanson Ida M
Bought by
Hanson Keith F
Purchase Details
Closed on
Aug 16, 1996
Sold by
Hanson Frans R and Mae Ida Mae
Bought by
Hanson Frans Richard and Hanson Ida Mae
Create a Home Valuation Report for This Property
The Home Valuation Report is an in-depth analysis detailing your home's value as well as a comparison with similar homes in the area
Home Values in the Area
Average Home Value in this Area
Purchase History
| Date | Buyer | Sale Price | Title Company |
|---|---|---|---|
| Keith And Tracy Hanson Living Trust | -- | Campbell Regina M | |
| Hanson Keith | -- | United Title Company | |
| Hanson Keith F | -- | -- | |
| Hanson Frans R | -- | -- | |
| Hanson Frans Richard | -- | -- |
Source: Public Records
Mortgage History
| Date | Status | Borrower | Loan Amount |
|---|---|---|---|
| Previous Owner | Hanson Keith | $250,000 |
Source: Public Records
Tax History
| Year | Tax Paid | Tax Assessment Tax Assessment Total Assessment is a certain percentage of the fair market value that is determined by local assessors to be the total taxable value of land and additions on the property. | Land | Improvement |
|---|---|---|---|---|
| 2025 | $5,370 | $422,376 | $37,315 | $385,061 |
| 2024 | $5,370 | $414,095 | $36,584 | $377,511 |
| 2023 | $5,175 | $405,976 | $35,867 | $370,109 |
| 2022 | $4,979 | $398,016 | $35,164 | $362,852 |
| 2021 | $4,820 | $390,212 | $34,474 | $355,738 |
| 2020 | $4,759 | $386,211 | $34,120 | $352,091 |
| 2019 | $4,658 | $378,639 | $33,451 | $345,188 |
| 2018 | $3,979 | $315,434 | $32,795 | $282,639 |
| 2017 | $3,599 | $279,153 | $32,152 | $247,001 |
| 2016 | $3,526 | $273,680 | $31,522 | $242,158 |
| 2015 | $3,492 | $269,570 | $31,049 | $238,521 |
| 2014 | $3,416 | $264,290 | $30,441 | $233,849 |
Source: Public Records
Map
Nearby Homes
- 1935 Tustin Ave
- 1173 Winslow Ln
- 2038 Aliso Ave
- 329 E 19th St
- 1924 Beryl Ln
- 1801 Beryl Ln
- 2127 Cresta Dr
- 2048 Garden Ln
- 450 Cabrillo St
- 1736 Bayport Way
- 300 Alva Ln
- 308 E 18th St
- 1741 Tustin Ave Unit 3C
- 1741 Tustin Ave Unit 5C
- 2033 Holiday Rd
- 1312 Dover Dr
- 375 E 21st St
- 1201 Estelle Ln
- 1633 Santiago Dr
- 1518 Anita Ln
Your Personal Tour Guide
Ask me questions while you tour the home.