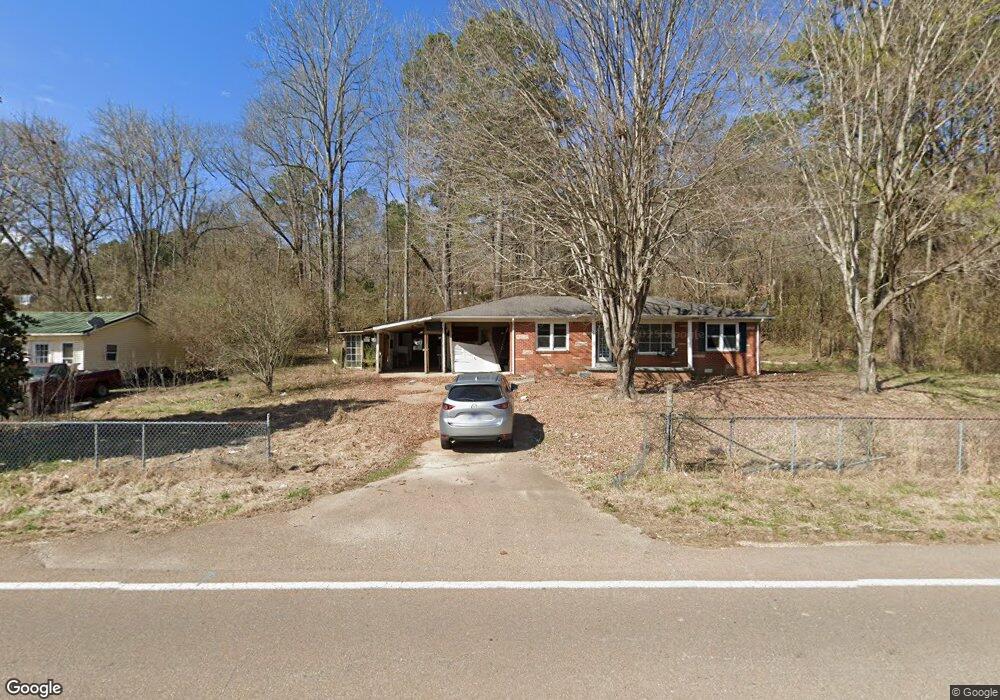
467 Waynesboro Hwy Waynesboro, TN 38485
Estimated Value: $149,354 - $228,000
--
Bed
1
Bath
1,260
Sq Ft
$155/Sq Ft
Est. Value
About This Home
This home is located at 467 Waynesboro Hwy, Waynesboro, TN 38485 and is currently estimated at $194,839, approximately $154 per square foot. 467 Waynesboro Hwy is a home located in Wayne County with nearby schools including Wayne Academy.
Ownership History
Date
Name
Owned For
Owner Type
Purchase Details
Closed on
Aug 4, 2015
Sold by
Inverse Asset Fund Llc
Bought by
Castle Financial Resource Llc
Current Estimated Value
Purchase Details
Closed on
Aug 3, 2015
Sold by
Harbour Portfolio Vi Lp
Bought by
Inverse Asset Fund Llc
Purchase Details
Closed on
Mar 8, 2011
Sold by
Federal National Mortgage Association
Bought by
Harbour Portfolio Vi Lp
Purchase Details
Closed on
Sep 13, 2010
Sold by
Staggs Elebert F
Bought by
Federal National Mtg Associati
Purchase Details
Closed on
Mar 4, 2004
Bought by
Staggs Elbert and Staggs Jeff Staggs
Purchase Details
Closed on
Jul 29, 1999
Sold by
Fincher Billy J
Bought by
Grady Perry
Home Financials for this Owner
Home Financials are based on the most recent Mortgage that was taken out on this home.
Original Mortgage
$36,870
Interest Rate
7.7%
Purchase Details
Closed on
Sep 12, 1994
Bought by
Fincher Billy J
Purchase Details
Closed on
Jan 30, 1986
Bought by
Wallace Thomas R and Wallace Sherry H
Purchase Details
Closed on
Mar 17, 1962
Create a Home Valuation Report for This Property
The Home Valuation Report is an in-depth analysis detailing your home's value as well as a comparison with similar homes in the area
Home Values in the Area
Average Home Value in this Area
Purchase History
| Date | Buyer | Sale Price | Title Company |
|---|---|---|---|
| Castle Financial Resource Llc | -- | -- | |
| Castle Financial Resources Llc | $51,900 | -- | |
| Inverse Asset Fund Llc | -- | -- | |
| Harbour Portfolio Vi Lp | $8,884 | -- | |
| Federal National Mtg Associati | $47,528 | -- | |
| Staggs Elbert | $54,000 | -- | |
| Grady Perry | $45,900 | -- | |
| Fincher Billy J | $32,000 | -- | |
| Wallace Thomas R | -- | -- | |
| -- | -- | -- |
Source: Public Records
Mortgage History
| Date | Status | Borrower | Loan Amount |
|---|---|---|---|
| Previous Owner | Not Available | $36,870 |
Source: Public Records
Tax History Compared to Growth
Tax History
| Year | Tax Paid | Tax Assessment Tax Assessment Total Assessment is a certain percentage of the fair market value that is determined by local assessors to be the total taxable value of land and additions on the property. | Land | Improvement |
|---|---|---|---|---|
| 2024 | $448 | $20,675 | $1,750 | $18,925 |
| 2023 | $396 | $20,675 | $1,750 | $18,925 |
| 2022 | $396 | $20,675 | $1,750 | $18,925 |
| 2021 | $321 | $20,675 | $1,750 | $18,925 |
| 2020 | $321 | $13,975 | $1,500 | $12,475 |
| 2019 | $321 | $13,975 | $1,500 | $12,475 |
| 2018 | $321 | $13,975 | $1,500 | $12,475 |
| 2017 | $321 | $13,975 | $1,500 | $12,475 |
| 2016 | $286 | $13,975 | $1,500 | $12,475 |
| 2015 | $308 | $13,975 | $1,500 | $12,475 |
| 2014 | $308 | $14,887 | $0 | $0 |
Source: Public Records
Map
Nearby Homes
- 0 Waynesboro Hwy Unit RTC2991221
- 0 Waynesboro Hwy Unit RTC2806893
- 0 Waynesboro Hwy Unit RTC2821045
- 711 Hurricane Hill Dr
- 131 Susan Ln
- 117 N High St
- 310 W Hill St
- 0 Simmons Branch Rd Unit 10181446
- 123 Brewer Dr
- 110 Turman St
- 418 Moore St
- 117 Belew Cir
- 202 Morris St
- 214 Mcwilliams St
- 308 S High St
- 107 W Songer St
- 1027 Highway 99
- 421 Highway 64 W
- 408 Poplar St
- 120 Wallace Dr
- 465 Waynesboro Hwy
- 7011 Elgie Dugger Ln
- 7011 Elgie Dugger Ln
- 477 Waynesboro Hwy
- 1465 Waynesboro Hwy
- 00 Waynesboro Hwy
- 7059 Elgie Dugger Ln
- 433 Waynesboro Hwy
- 644 Waynesboro Hwy
- 740 Highway 13
- 501 Waynesboro Hwy
- 225 Emmett Skelton Rd
- 539 Waynesboro Hwy
- 511 Michael Dr
- 2100 Mount Hope Rd
- 387 Faye Dr
- 1904 Old Hog Creek Rd
- 333 Michael Dr
- 2118 Mount Hope Rd
- 571 Waynesboro Hwy