4670 Ludlow St Boulder, CO 80305
South Boulder NeighborhoodEstimated Value: $973,000 - $1,010,000
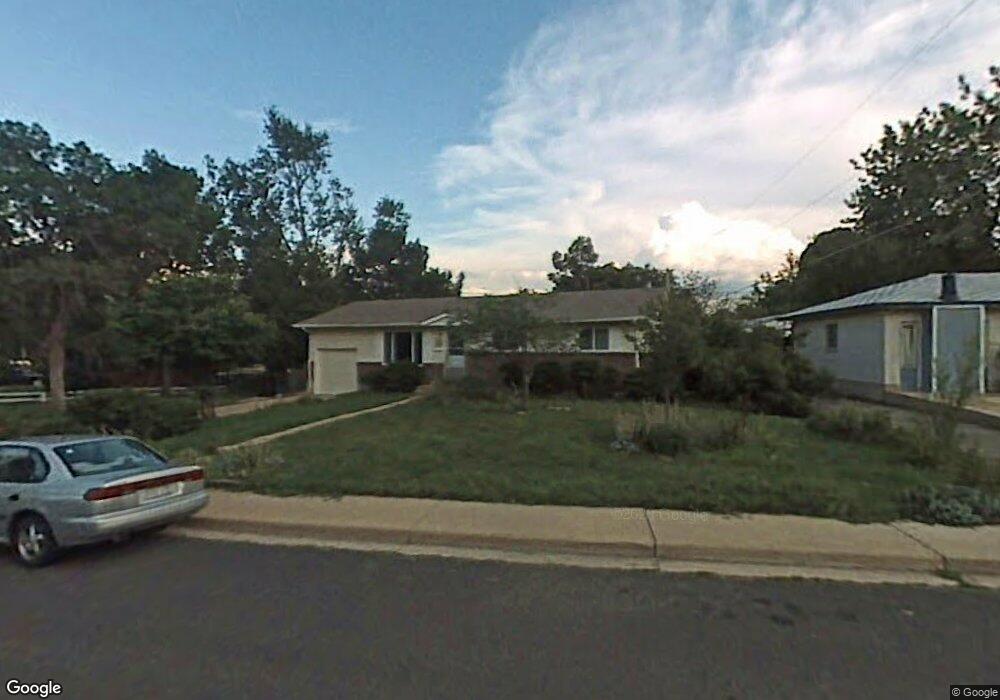
About This Home
This home is located at 4670 Ludlow St, Boulder, CO 80305 and is currently estimated at $994,332, approximately $497 per square foot. 4670 Ludlow St is a home located in Boulder County with nearby schools including Creekside Elementary School, Southern Hills Middle School, and Fairview High School.
Ownership History
We collect this data history from publicly available records. To have your information removed, we recommend requesting removal directly through your county’s website.
Purchase Details
Home Financials for this Owner
Home Financials are based on the most recent Mortgage that was taken out on this home.Purchase Details
Home Financials for this Owner
Home Financials are based on the most recent Mortgage that was taken out on this home.Purchase Details
Home Financials for this Owner
Home Financials are based on the most recent Mortgage that was taken out on this home.Home Values in the Area
Average Home Value in this Area
Purchase History
We collect this data history from publicly available records. To have your information removed, we recommend requesting removal directly through your county’s website.
| Date | Buyer | Sale Price | Title Company |
|---|---|---|---|
| $404,500 | Land Title Guarantee Company | ||
| $365,000 | Land Title | ||
| $239,900 | -- |
Mortgage History
We collect this data history from publicly available records. To have your information removed, we recommend requesting removal directly through your county’s website.
| Date | Status | Borrower | Loan Amount |
|---|---|---|---|
| Open | $394,245 | ||
| Previous Owner | $292,000 | ||
| Previous Owner | $179,925 |
Tax History
We collect this data history from publicly available records. To have your information removed, we recommend requesting removal directly through your county’s website.
| Year | Tax Paid | Tax Assessment Tax Assessment Total Assessment is a certain percentage of the fair market value that is determined by local assessors to be the total taxable value of land and additions on the property. | Land | Improvement |
|---|---|---|---|---|
| 2025 | $5,427 | $61,928 | $38,148 | $23,780 |
| 2024 | $5,424 | $56,919 | $35,063 | $21,856 |
| 2023 | $5,330 | $61,714 | $41,440 | $23,959 |
| 2022 | $4,683 | $50,429 | $30,851 | $19,578 |
| 2021 | $4,466 | $51,881 | $31,739 | $20,142 |
| 2020 | $4,275 | $49,107 | $29,959 | $19,148 |
| 2019 | $4,209 | $49,107 | $29,959 | $19,148 |
| 2018 | $3,934 | $45,374 | $27,648 | $17,726 |
| 2017 | $3,811 | $50,164 | $30,566 | $19,598 |
| 2016 | $3,499 | $40,421 | $19,184 | $21,237 |
| 2015 | $3,313 | $31,434 | $12,099 | $19,335 |
| 2014 | $2,643 | $31,434 | $12,099 | $19,335 |
Map
- 4685 MacKy Way
- 1495 Chambers Dr
- 4790 W Moorhead Cir
- 1160 S Lashley Ln
- 4844 W Moorhead Cir
- 1542 Chambers Dr Unit 42
- 4400 Brookfield Dr
- 1039 E Moorhead Cir
- 1466 Greenbriar Blvd
- 1566 Greenbriar Blvd Unit 132
- 1546 Greenbriar Blvd
- 1494 Greenbriar Blvd
- 4260 Whitney Place
- 1380 Knox Dr
- 1533 Bradley Dr
- 1534 Bradley Dr Unit A202
- 780 W Moorhead Cir Unit B
- 1596 Bradley Dr Unit 105C
- 750 W Moorhead Cir Unit A
- 725 S 45th St
- 4660 Ludlow St
- 4680 Ludlow St
- 1207 Aikins Way
- 1215 Aikins Way
- 4650 Ludlow St
- 4665 Ludlow St
- 4675 Ludlow St
- 4645 Ludlow St
- 1223 Aikins Way
- 4685 Ludlow St
- 4640 Ludlow St
- 4635 Ludlow St
- 4692 Gordon Dr
- 1200 Aikins Way
- 1227 Aikins Way
- 1210 Aikins Way
- 1216 Aikins Way
- 4636 Gordon Dr
- 4632 Gordon Dr
- 1206 Aikins Way
Ask me questions while you tour the home.