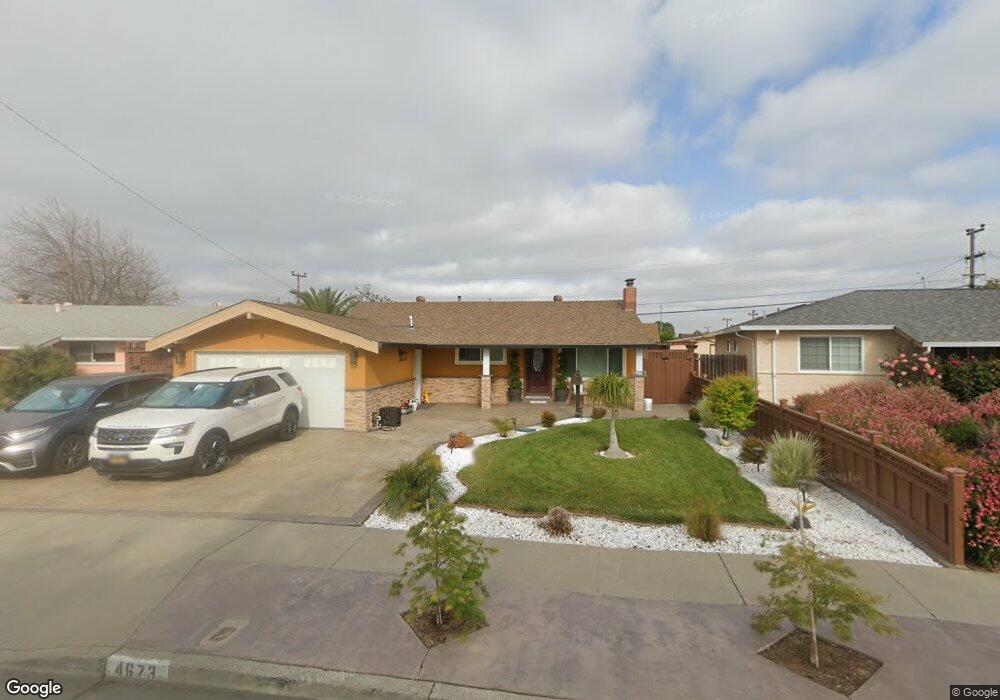
4673 Sloan St Fremont, CA 94538
Sundale NeighborhoodEstimated Value: $1,020,000 - $1,394,000
3
Beds
1
Bath
1,260
Sq Ft
$1,004/Sq Ft
Est. Value
About This Home
This home is located at 4673 Sloan St, Fremont, CA 94538 and is currently estimated at $1,264,497, approximately $1,003 per square foot. 4673 Sloan St is a home located in Alameda County with nearby schools including Brier Elementary School, G.M. Walters Middle School, and John F. Kennedy High School.
Ownership History
Date
Name
Owned For
Owner Type
Purchase Details
Closed on
Nov 13, 2002
Sold by
Benchmark Investments Llc
Bought by
Cardona Ruben and Cardona Lorena
Current Estimated Value
Home Financials for this Owner
Home Financials are based on the most recent Mortgage that was taken out on this home.
Original Mortgage
$325,600
Outstanding Balance
$135,074
Interest Rate
5.89%
Mortgage Type
Stand Alone First
Estimated Equity
$1,129,423
Purchase Details
Closed on
Jul 2, 2002
Sold by
Mcadoo Marva and Alston Ulysses
Bought by
Benchmark Investments Llc
Purchase Details
Closed on
Nov 6, 2001
Sold by
Mcadoo Marva and Alston Ulysses
Bought by
Alston Ulysses
Purchase Details
Closed on
Mar 9, 2001
Sold by
Alston Ulysses
Bought by
Mcadoo Marva
Purchase Details
Closed on
Jan 20, 2001
Sold by
Mcadoo Marva L
Bought by
Alston Ulysses
Purchase Details
Closed on
Jul 12, 2000
Sold by
Alston Ulysses
Bought by
Mcadoo Marva L
Purchase Details
Closed on
Aug 19, 1998
Sold by
Alston Gina V
Bought by
Alston Ulysses
Create a Home Valuation Report for This Property
The Home Valuation Report is an in-depth analysis detailing your home's value as well as a comparison with similar homes in the area
Home Values in the Area
Average Home Value in this Area
Purchase History
| Date | Buyer | Sale Price | Title Company |
|---|---|---|---|
| Cardona Ruben | $407,000 | American Title Company | |
| Benchmark Investments Llc | $333,800 | -- | |
| Alston Ulysses | -- | -- | |
| Mcadoo Marva | -- | North American Title Co | |
| Alston Ulysses | -- | -- | |
| Mcadoo Marva L | -- | -- | |
| Alston Ulysses | -- | -- |
Source: Public Records
Mortgage History
| Date | Status | Borrower | Loan Amount |
|---|---|---|---|
| Open | Cardona Ruben | $325,600 |
Source: Public Records
Tax History Compared to Growth
Tax History
| Year | Tax Paid | Tax Assessment Tax Assessment Total Assessment is a certain percentage of the fair market value that is determined by local assessors to be the total taxable value of land and additions on the property. | Land | Improvement |
|---|---|---|---|---|
| 2025 | $7,367 | $589,417 | $176,680 | $412,737 |
| 2024 | $7,367 | $577,861 | $173,216 | $404,645 |
| 2023 | $7,164 | $566,535 | $169,821 | $396,714 |
| 2022 | $7,062 | $555,428 | $166,492 | $388,936 |
| 2021 | $6,892 | $544,540 | $163,228 | $381,312 |
| 2020 | $6,881 | $538,961 | $161,556 | $377,405 |
| 2019 | $6,804 | $528,394 | $158,388 | $370,006 |
| 2018 | $6,671 | $518,037 | $155,284 | $362,753 |
| 2017 | $6,506 | $507,882 | $152,240 | $355,642 |
| 2016 | $6,391 | $497,927 | $149,256 | $348,671 |
| 2015 | $6,302 | $490,450 | $147,014 | $343,436 |
| 2014 | $6,191 | $480,845 | $144,135 | $336,710 |
Source: Public Records
Map
Nearby Homes
- 4692 Nelson St
- 4600 Nelson St
- 4737 Boone Dr
- 39530 Dorrington Ct
- 4714 Serra Ave
- 5033 Blacksand Rd
- 5330 Coco Palm Dr
- 40116 Crockett St
- 39090 Presidio Way Unit 237
- 39753 Placer Way
- 5589 Roosevelt Place
- 4840 Piper St
- 5580 Hemlock Terrace
- 39751 Bissy Common
- 5624 Chestnut Common
- 4572 De Silva St
- 4453 Porter St
- 4715 Mildred Dr
- 40422 Landon Ave
- 39993 Fremont Blvd Unit 102
- 4667 Sloan St
- 4679 Sloan St
- 39448 Sundale Dr
- 39460 Sundale Dr
- 39436 Sundale Dr
- 4661 Sloan St
- 4685 Sloan St
- 39472 Sundale Dr
- 39424 Sundale Dr
- 4670 Sloan St
- 4655 Sloan St
- 4664 Sloan St
- 4684 Sloan St
- 39484 Sundale Dr
- 4691 Sloan St
- 39412 Sundale Dr
- 4658 Sloan St
- 39508 Sundale Dr
- 4649 Sloan St
- 4692 Sloan St