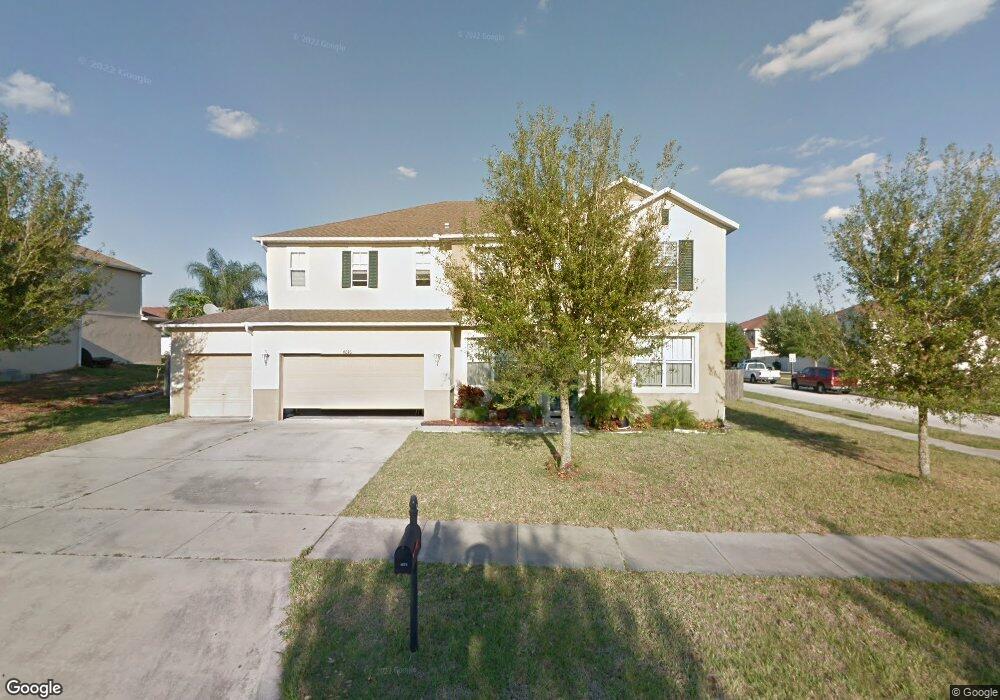
4676 Barbados Loop Clermont, FL 34711
Estimated Value: $518,000 - $582,718
5
Beds
3
Baths
4,162
Sq Ft
$135/Sq Ft
Est. Value
About This Home
This home is located at 4676 Barbados Loop, Clermont, FL 34711 and is currently estimated at $561,430, approximately $134 per square foot. 4676 Barbados Loop is a home located in Lake County with nearby schools including Lost Lake Elementary School, Windy Hill Middle School, and East Ridge High School.
Ownership History
Date
Name
Owned For
Owner Type
Purchase Details
Closed on
Feb 20, 2015
Sold by
All Steven R
Bought by
Ali Nayeem I and Nabbie Haroonah R
Current Estimated Value
Home Financials for this Owner
Home Financials are based on the most recent Mortgage that was taken out on this home.
Original Mortgage
$188,237
Outstanding Balance
$143,278
Interest Rate
3.75%
Mortgage Type
FHA
Estimated Equity
$418,152
Purchase Details
Closed on
Jul 29, 2011
Sold by
Londono Sandra M and Salazar Pedro Nel
Bought by
Ali Steven R
Home Financials for this Owner
Home Financials are based on the most recent Mortgage that was taken out on this home.
Original Mortgage
$7,500
Interest Rate
4.52%
Mortgage Type
Stand Alone Second
Purchase Details
Closed on
May 31, 2006
Sold by
Kb Home Orlando
Bought by
Salazar Pedro Nel and Londono Sandra M
Home Financials for this Owner
Home Financials are based on the most recent Mortgage that was taken out on this home.
Original Mortgage
$424,700
Interest Rate
7.5%
Mortgage Type
New Conventional
Create a Home Valuation Report for This Property
The Home Valuation Report is an in-depth analysis detailing your home's value as well as a comparison with similar homes in the area
Purchase History
| Date | Buyer | Sale Price | Title Company |
|---|---|---|---|
| Ali Nayeem I | $220,000 | Vp Title & Trust | |
| Ali Steven R | $155,000 | Dba Vp Title & Trust | |
| Salazar Pedro Nel | $447,100 | First American Title Ins Co |
Source: Public Records
Mortgage History
| Date | Status | Borrower | Loan Amount |
|---|---|---|---|
| Open | Ali Nayeem I | $188,237 | |
| Previous Owner | Ali Steven R | $7,500 | |
| Previous Owner | Ali Steven R | $140,895 | |
| Previous Owner | Salazar Pedro Nel | $424,700 |
Source: Public Records
Tax History
| Year | Tax Paid | Tax Assessment Tax Assessment Total Assessment is a certain percentage of the fair market value that is determined by local assessors to be the total taxable value of land and additions on the property. | Land | Improvement |
|---|---|---|---|---|
| 2026 | $4,741 | $383,728 | -- | -- |
| 2025 | $4,396 | $345,008 | -- | -- |
| 2024 | $4,396 | $345,008 | -- | -- |
| 2023 | $4,396 | $310,422 | $0 | $0 |
| 2022 | $4,062 | $287,133 | $0 | $0 |
| 2021 | $3,557 | $250,147 | $0 | $0 |
| 2020 | $3,440 | $241,656 | $0 | $0 |
| 2019 | $3,521 | $236,859 | $0 | $0 |
| 2018 | $3,110 | $217,091 | $0 | $0 |
| 2017 | $2,963 | $207,561 | $0 | $0 |
| 2016 | $3,022 | $207,561 | $0 | $0 |
| 2015 | $2,372 | $167,531 | $0 | $0 |
| 2014 | $2,310 | $166,202 | $0 | $0 |
Source: Public Records
Map
Nearby Homes
- 3026 Anquilla Ave
- 2916 Majestic Isle Dr
- 3064 Tobago Ave
- 3106 Anquilla Ave
- 2735 Kingston Ridge Dr
- 4277 Bugle St
- 4448 Harts Cove Way
- 4614 Cragmere Loop
- 4724 Cragmere Loop
- 4653 Cragmere Loop
- 4262 Caplock St
- 4507 Davos Dr
- 4767 Cragmere Loop
- 4426 Davos Dr
- 4484 Lions Gate Ave
- 4542 Lions Gate Ave
- 4442 Lions Gate Dr
- 4495 Lions Gate Ave
- 3643 Peaceful Valley Dr
- 4418 Lions Gate Ave
- 4680 Barbados Loop
- 3022 Anquilla Ave
- 4684 Barbados Loop
- 4673 Barbados Loop
- 3025 Tobago Ave
- 4677 Barbados Loop
- 3023 Anquilla Ave
- 4681 Barbados Loop
- 3029 Tobago Ave
- 3027 Anquilla Ave
- 3030 Anquilla Ave
- 4685 Barbados Loop
- 3033 Tobago Ave
- 3031 Anquilla Ave
- 2900 Majestic Isle Dr
- 4694 Barbados Loop
- 4689 Barbados Loop
- 4640 Barbados Loop
- 3034 Anquilla Ave
- 2896 Majestic Isle Dr
Your Personal Tour Guide
Ask me questions while you tour the home.