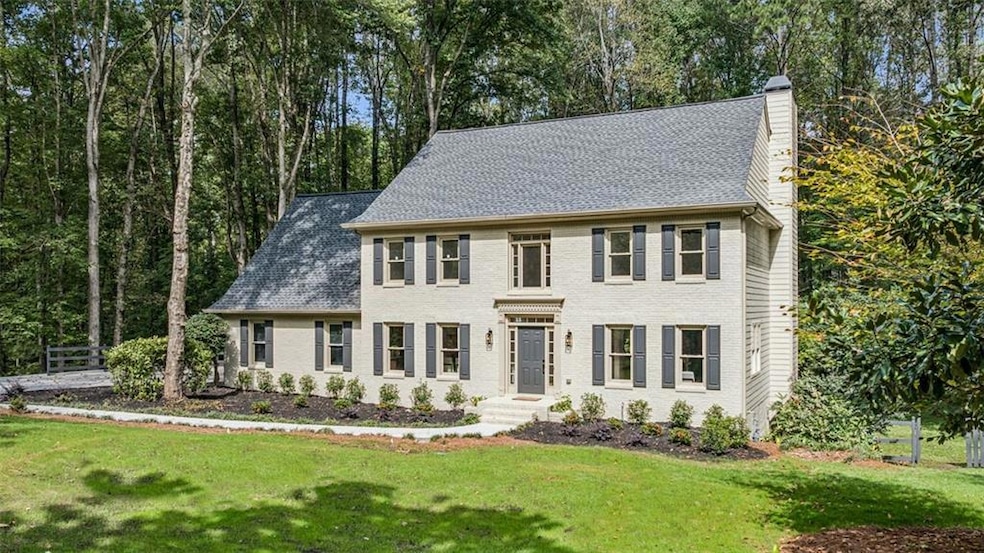


4676 Jefferson Township Ln Marietta, GA 30066
Sandy Plains NeighborhoodEstimated payment $5,226/month
Highlights
- View of Trees or Woods
- 1.03 Acre Lot
- Deck
- Garrison Mill Elementary School Rated A
- Clubhouse
- Wooded Lot
About This Home
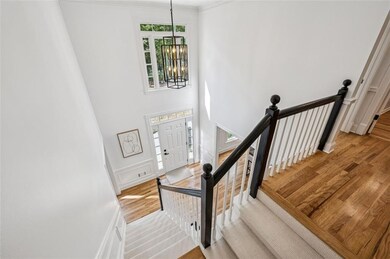
Welcome to this gracious and updated classic brick in the sought-after Jefferson Township community! From the dramatic two-story foyer to the shiplapped screened porch overlooking a lush, backyard — this home truly has it all.
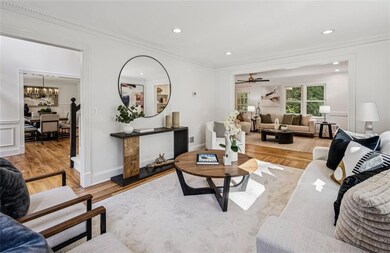
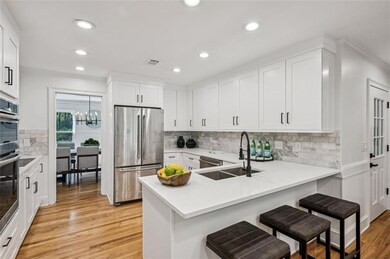
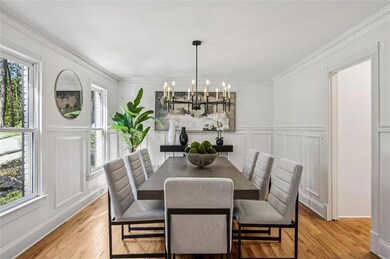
The upgraded eat-in kitchen features quartz countertops, crisp white cabinetry, sleek stainless steel appliances, and a charming pantry. The gleaming real oak hardwood floors flow throughout the main level, complemented by upgraded lighting, crown molding, and paneled details. The flexible floor plan is flooded with natural light and includes a formal dining room and easy transitions between living spaces, perfect for entertaining or relaxing at home.
Step onto the screened porch to enjoy your morning coffee and the cool breeze, surrounded by shiplap finishes and pastoral views. The spacious deck extends your living area outdoors — ideal for gatherings or quiet evenings.
Upstairs, the primary suite offers a peaceful retreat with a spa-like bath, while three additional bedrooms and a full bath complete the upper level. The terrace level includes another bedroom and bath, plus versatile flex space perfect for a home office, gym, or guest suite.
The fenced backyard provides plenty of room for play — perfect for pets or outdoor activities.
Jefferson Township offers a clubhouse, pool, tennis courts, and playground, all within minutes of Historic Downtown Marietta, Marietta Square, and Mabry Park. Convenient access to GA-400 and I-75 ensures an easy commute to shopping, dining, and entertainment. Local favorites such as Yeero Village, Lucia’s Italian, Mika Sushi, RISE Coffee & Tea, and Publix are just minutes away. Enjoy quick access to Roswell, Alpharetta, and Avalon for even more retail and nightlife options.
Home Details
Home Type
- Single Family
Est. Annual Taxes
- $7,824
Year Built
- Built in 1985 | Remodeled
Lot Details
- 1.03 Acre Lot
- Lot Dimensions are 75 x 237 x 200 x 146 x172
- Wooded Lot
- Back Yard Fenced
HOA Fees
- $33 Monthly HOA Fees
Parking
- 2 Car Garage
- Driveway
Home Design
- Traditional Architecture
- Slab Foundation
- Composition Roof
- Brick Front
Interior Spaces
- 3-Story Property
- Crown Molding
- Ceiling Fan
- Double Pane Windows
- Two Story Entrance Foyer
- Family Room with Fireplace
- Living Room
- Formal Dining Room
- Screened Porch
- Views of Woods
- Fire and Smoke Detector
Kitchen
- Breakfast Bar
- Walk-In Pantry
- Electric Oven
- Electric Cooktop
- Microwave
- Dishwasher
- Solid Surface Countertops
- White Kitchen Cabinets
- Disposal
Flooring
- Wood
- Carpet
Bedrooms and Bathrooms
- Oversized primary bedroom
- Walk-In Closet
- Dual Vanity Sinks in Primary Bathroom
- Separate Shower in Primary Bathroom
- Soaking Tub
Laundry
- Laundry Room
- Laundry on main level
Finished Basement
- Basement Fills Entire Space Under The House
- Interior and Exterior Basement Entry
- Finished Basement Bathroom
- Natural lighting in basement
Location
- Property is near schools
- Property is near shops
Schools
- Garrison Mill Elementary School
- Mabry Middle School
- Lassiter High School
Utilities
- Central Heating and Cooling System
- Septic Tank
- High Speed Internet
Additional Features
- Energy-Efficient Thermostat
- Deck
Listing and Financial Details
- Legal Lot and Block 29 / A
- Assessor Parcel Number 16003300210
Community Details
Overview
- $305 Swim or Tennis Fee
- $1,857 Initiation Fee
- Tolley Community Management Association, Phone Number (770) 517-1761
- Jefferson Township Subdivision
Amenities
- Clubhouse
Recreation
- Tennis Courts
- Community Playground
- Swim or tennis dues are optional
- Community Pool
Map
Home Values in the Area
Average Home Value in this Area
Tax History
| Year | Tax Paid | Tax Assessment Tax Assessment Total Assessment is a certain percentage of the fair market value that is determined by local assessors to be the total taxable value of land and additions on the property. | Land | Improvement |
|---|---|---|---|---|
| 2025 | $7,819 | $259,516 | $100,000 | $159,516 |
| 2024 | $7,824 | $259,516 | $100,000 | $159,516 |
| 2023 | $6,919 | $229,480 | $100,000 | $129,480 |
| 2022 | $4,061 | $133,800 | $40,360 | $93,440 |
| 2021 | $5,632 | $185,568 | $56,000 | $129,568 |
| 2020 | $5,208 | $171,592 | $56,000 | $115,592 |
| 2019 | $5,208 | $171,592 | $56,000 | $115,592 |
| 2018 | $5,123 | $168,804 | $56,000 | $112,804 |
| 2017 | $4,853 | $168,804 | $56,000 | $112,804 |
| 2016 | $4,358 | $151,584 | $50,000 | $101,584 |
| 2015 | $4,466 | $151,584 | $50,000 | $101,584 |
| 2014 | $4,504 | $151,584 | $0 | $0 |
Property History
| Date | Event | Price | List to Sale | Price per Sq Ft | Prior Sale |
|---|---|---|---|---|---|
| 11/14/2025 11/14/25 | Sold | $860,000 | 0.0% | $225 / Sq Ft | View Prior Sale |
| 10/26/2025 10/26/25 | Pending | -- | -- | -- | |
| 10/09/2025 10/09/25 | For Sale | $859,900 | -- | $225 / Sq Ft |
Purchase History
| Date | Type | Sale Price | Title Company |
|---|---|---|---|
| Special Warranty Deed | $334,500 | Fryer Law Firm | |
| Deed | $349,000 | -- | |
| Quit Claim Deed | -- | -- |
Mortgage History
| Date | Status | Loan Amount | Loan Type |
|---|---|---|---|
| Open | $250,875 | New Conventional | |
| Previous Owner | $331,550 | New Conventional | |
| Previous Owner | $280,000 | New Conventional |
Source: First Multiple Listing Service (FMLS)
MLS Number: 7657042
APN: 16-0033-0-021-0
Disclaimer: Certain information contained herein is derived from information provided by parties other than Homes.com. All information provided is deemed reliable, but is not guaranteed to be accurate and should be independently verified.
![]() Listings identified with the FMLS IDX logo come from FMLS and are held by brokerage firms other than the owner of this website. The listing brokerage is identified in any listing details. Information is deemed reliable but is not guaranteed. If you believe any FMLS listing contains material that infringes your copyrighted work please visit www.fmls.com/dmca to review our DMCA policy and learn how to submit a takedown request. © 2025 First Multiple Listing Service, Inc.
Listings identified with the FMLS IDX logo come from FMLS and are held by brokerage firms other than the owner of this website. The listing brokerage is identified in any listing details. Information is deemed reliable but is not guaranteed. If you believe any FMLS listing contains material that infringes your copyrighted work please visit www.fmls.com/dmca to review our DMCA policy and learn how to submit a takedown request. © 2025 First Multiple Listing Service, Inc.
- 375 Crider Ct
- 4673 Jefferson Township Place
- 359 Crider Ct
- 153 Witter Way
- 320 Crider Ct
- 146 Bellehaven Dr
- 4765 Catoosa Trail NE Unit 2
- 415 Bellehaven Ln
- 136 Wiley Parc Cir
- 123 Ivey Way
- 226 Parc View Ln
- 109 Wiley Parc Cir
- 4304 Lindsey Way NE
- 1001 Wiley Bridge Rd
- 4734 Outlook Way NE
- 989 Wiley Bridge Rd
- 1003 Wiley Bridge Rd
- 3465 Township Ridge Point
