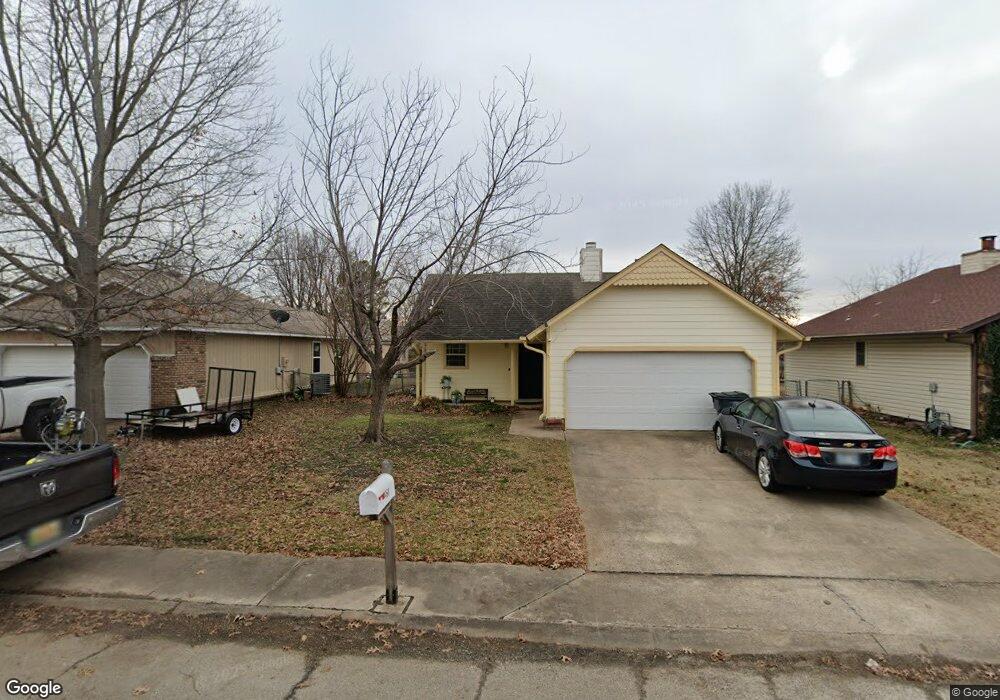
468 E 142nd St Glenpool, OK 74033
Estimated Value: $152,000 - $207,000
3
Beds
2
Baths
996
Sq Ft
$176/Sq Ft
Est. Value
About This Home
This home is located at 468 E 142nd St, Glenpool, OK 74033 and is currently estimated at $175,201, approximately $175 per square foot. 468 E 142nd St is a home located in Tulsa County with nearby schools including Glenpool Elementary School, Glenpool Middle School, and Glenpool High School.
Ownership History
Date
Name
Owned For
Owner Type
Purchase Details
Closed on
Mar 18, 2016
Sold by
Ferrell Sandra Lynn
Bought by
C & C Holdings Inc
Current Estimated Value
Purchase Details
Closed on
Feb 9, 2016
Sold by
Glenpool Properties Llc
Purchase Details
Closed on
Sep 6, 2006
Sold by
Jpmorgan Chase Bank
Bought by
Ferrell Allen
Home Financials for this Owner
Home Financials are based on the most recent Mortgage that was taken out on this home.
Original Mortgage
$60,000
Interest Rate
6.55%
Mortgage Type
Purchase Money Mortgage
Purchase Details
Closed on
Jul 13, 2006
Sold by
Coats Brian Neal
Bought by
Jpmorgan Chase Bank and Bank One Na
Home Financials for this Owner
Home Financials are based on the most recent Mortgage that was taken out on this home.
Original Mortgage
$60,000
Interest Rate
6.55%
Mortgage Type
Purchase Money Mortgage
Purchase Details
Closed on
Aug 1, 1991
Purchase Details
Closed on
Jul 1, 1988
Create a Home Valuation Report for This Property
The Home Valuation Report is an in-depth analysis detailing your home's value as well as a comparison with similar homes in the area
Home Values in the Area
Average Home Value in this Area
Purchase History
| Date | Buyer | Sale Price | Title Company |
|---|---|---|---|
| C & C Holdings Inc | -- | Tulsa Abstract & Title | |
| -- | -- | None Available | |
| Ferrell Allen | $67,500 | First Financial Title Agency | |
| Jpmorgan Chase Bank | -- | None Available | |
| -- | $37,000 | -- | |
| -- | $36,000 | -- |
Source: Public Records
Mortgage History
| Date | Status | Borrower | Loan Amount |
|---|---|---|---|
| Previous Owner | Ferrell Allen | $60,000 |
Source: Public Records
Tax History
| Year | Tax Paid | Tax Assessment Tax Assessment Total Assessment is a certain percentage of the fair market value that is determined by local assessors to be the total taxable value of land and additions on the property. | Land | Improvement |
|---|---|---|---|---|
| 2025 | $1,322 | $11,029 | $1,266 | $9,763 |
| 2024 | $1,171 | $10,504 | $1,466 | $9,038 |
| 2023 | $1,171 | $10,003 | $1,306 | $8,697 |
| 2022 | $1,098 | $9,527 | $2,020 | $7,507 |
| 2021 | $1,093 | $9,340 | $1,980 | $7,360 |
| 2020 | $1,072 | $9,095 | $1,928 | $7,167 |
| 2019 | $1,028 | $8,662 | $1,836 | $6,826 |
| 2018 | $975 | $8,250 | $1,749 | $6,501 |
| 2017 | $954 | $8,250 | $1,749 | $6,501 |
| 2016 | $964 | $8,250 | $1,749 | $6,501 |
| 2015 | $894 | $7,689 | $1,749 | $5,940 |
| 2014 | $898 | $7,689 | $1,749 | $5,940 |
Source: Public Records
Map
Nearby Homes
- 687 E 142nd Place
- 14692 S College St
- 14708 S Hickory Cir
- 394 E 147th St S
- 41 E 148th St
- 109 E 149th St
- 14760 S Fern Place
- 265 E Glenpool Blvd
- 243 E 141st St
- 1122 E 144th Place
- 13653 S Hickory Place
- 380 E 148th St S
- 1188 E 143rd St
- 663 E 148th Place S
- 603 E 135th Place
- 14910 S Sequoia St
- 668 E 148th Place S
- 14920 S Sequoia St
- 849 E 148th Place S
- 667 E 149th St S
- 462 E 142nd St
- 472 E 142nd St
- 458 E 142nd St
- 461 E 142nd Place
- 471 E 142nd Place
- 478 E 142nd St
- 457 E 142nd Place
- 469 E 142nd St
- 463 E 142nd St
- 473 E 142nd St
- 482 E 142nd St
- 479 E 142nd St
- 481 E 142nd Place
- 483 E 142nd St
- 470 E 141st Place
- 462 E 142nd Place
- 474 E 141st Place
- 464 E 141st Place
- 458 E 142nd Place
- 492 E 142nd St
Your Personal Tour Guide
Ask me questions while you tour the home.