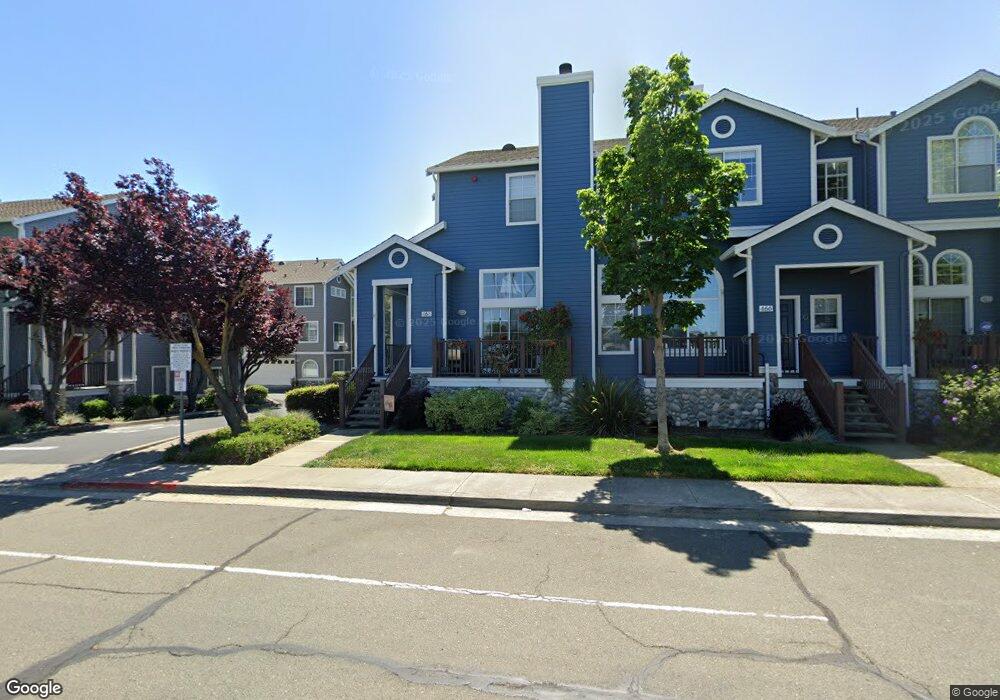
468 E E St Benicia, CA 94510
Estimated Value: $630,000 - $727,000
3
Beds
3
Baths
1,640
Sq Ft
$414/Sq Ft
Est. Value
About This Home
This home is located at 468 E E St, Benicia, CA 94510 and is currently estimated at $678,553, approximately $413 per square foot. 468 E E St is a home located in Solano County with nearby schools including Mary Farmar Elementary School, Benicia Middle School, and Benicia High School.
Ownership History
Date
Name
Owned For
Owner Type
Purchase Details
Closed on
Apr 1, 2013
Sold by
Lee Elisabeth and Grindling Elisabeth M
Bought by
Henretty Edward W and Henretty Barbara J
Current Estimated Value
Purchase Details
Closed on
Jul 13, 2006
Sold by
Fischer Peter H O and Fischer Magdalena N
Bought by
Grindling Elisabeth M
Home Financials for this Owner
Home Financials are based on the most recent Mortgage that was taken out on this home.
Original Mortgage
$483,000
Interest Rate
6.57%
Mortgage Type
Purchase Money Mortgage
Purchase Details
Closed on
Aug 26, 2004
Sold by
Fischer Peter and Fischer Magdalena
Bought by
Fischer Peter H O and Fischer Magdalena N
Purchase Details
Closed on
Nov 4, 1998
Sold by
Kaufman & Broad Of Northern Ca Inc
Bought by
Fischer Peter and Fischer Magdalena
Home Financials for this Owner
Home Financials are based on the most recent Mortgage that was taken out on this home.
Original Mortgage
$195,000
Interest Rate
6.54%
Create a Home Valuation Report for This Property
The Home Valuation Report is an in-depth analysis detailing your home's value as well as a comparison with similar homes in the area
Purchase History
| Date | Buyer | Sale Price | Title Company |
|---|---|---|---|
| Henretty Edward W | $250,000 | First American Title Company | |
| Grindling Elisabeth M | $515,000 | Alliance Title Company | |
| Fischer Peter H O | -- | -- | |
| Fischer Peter | $217,000 | First American Title |
Source: Public Records
Mortgage History
| Date | Status | Borrower | Loan Amount |
|---|---|---|---|
| Previous Owner | Grindling Elisabeth M | $483,000 | |
| Previous Owner | Fischer Peter | $195,000 |
Source: Public Records
Tax History
| Year | Tax Paid | Tax Assessment Tax Assessment Total Assessment is a certain percentage of the fair market value that is determined by local assessors to be the total taxable value of land and additions on the property. | Land | Improvement |
|---|---|---|---|---|
| 2025 | $3,903 | $332,474 | $80,036 | $252,438 |
| 2024 | $3,903 | $325,956 | $78,467 | $247,489 |
| 2023 | $3,809 | $319,566 | $76,929 | $242,637 |
| 2022 | $3,739 | $313,301 | $75,422 | $237,879 |
| 2021 | $3,663 | $307,159 | $73,944 | $233,215 |
| 2020 | $3,614 | $304,010 | $73,186 | $230,824 |
| 2019 | $3,552 | $298,050 | $71,751 | $226,299 |
| 2018 | $3,461 | $292,207 | $70,345 | $221,862 |
| 2017 | $3,381 | $286,478 | $68,966 | $217,512 |
| 2016 | $3,405 | $280,862 | $67,614 | $213,248 |
| 2015 | $3,319 | $276,644 | $66,599 | $210,045 |
| 2014 | $3,280 | $271,226 | $65,295 | $205,931 |
Source: Public Records
Map
Nearby Homes
Your Personal Tour Guide
Ask me questions while you tour the home.