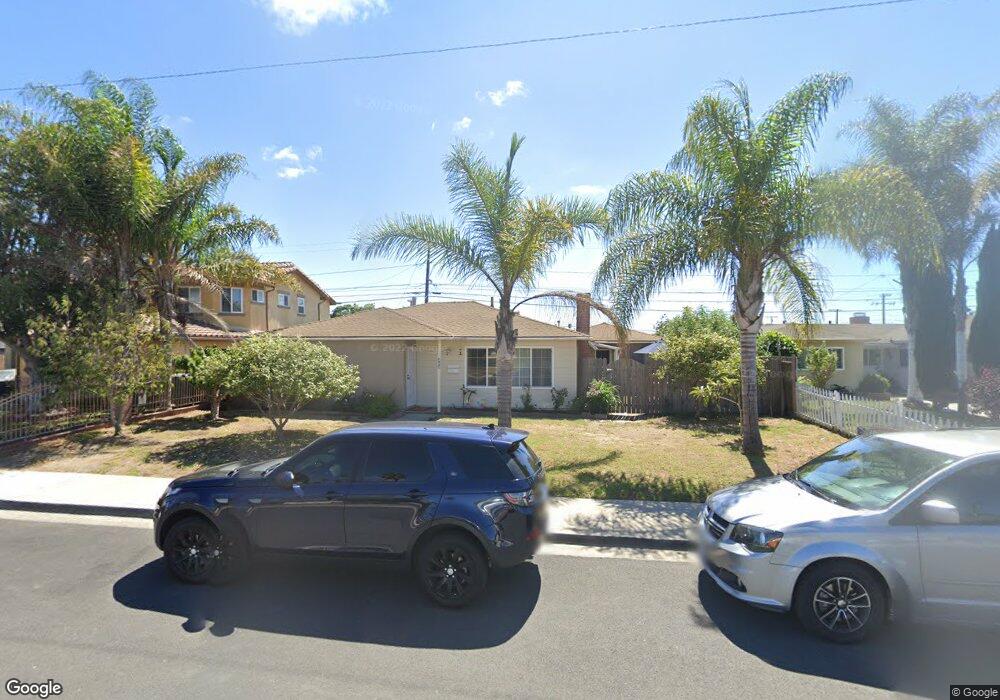
468 Redwood St Oxnard, CA 93033
Bryce Canyon North NeighborhoodEstimated Value: $604,000 - $691,000
3
Beds
2
Baths
1,112
Sq Ft
$567/Sq Ft
Est. Value
About This Home
This home is located at 468 Redwood St, Oxnard, CA 93033 and is currently estimated at $630,908, approximately $567 per square foot. 468 Redwood St is a home located in Ventura County with nearby schools including Sunkist Elementary School, Hueneme High School, and St. Anthony's Elementary School.
Ownership History
Date
Name
Owned For
Owner Type
Purchase Details
Closed on
Jun 10, 2020
Sold by
Flores Enrique and Patino Enrique Flores
Bought by
Flores Enrique and Flores Virgilio
Current Estimated Value
Home Financials for this Owner
Home Financials are based on the most recent Mortgage that was taken out on this home.
Original Mortgage
$270,000
Outstanding Balance
$239,334
Interest Rate
3.2%
Mortgage Type
New Conventional
Estimated Equity
$391,574
Purchase Details
Closed on
Jul 15, 2011
Sold by
Patino Enrique Flores and Cedillo Florencio Hernandez
Bought by
Patino Enrique Flores
Purchase Details
Closed on
Jun 4, 2010
Sold by
Mendes Lisa
Bought by
Patino Enrique Flores and Cedillo Florencio Hernandez
Home Financials for this Owner
Home Financials are based on the most recent Mortgage that was taken out on this home.
Original Mortgage
$273,319
Interest Rate
3.5%
Mortgage Type
FHA
Purchase Details
Closed on
Jul 25, 2006
Sold by
Flores Guadalupe
Bought by
Flores Guadalupe C
Create a Home Valuation Report for This Property
The Home Valuation Report is an in-depth analysis detailing your home's value as well as a comparison with similar homes in the area
Home Values in the Area
Average Home Value in this Area
Purchase History
| Date | Buyer | Sale Price | Title Company |
|---|---|---|---|
| Flores Enrique | -- | Stewart Title Of Ca Inc | |
| Flores Enrique | -- | None Available | |
| Patino Enrique Flores | -- | None Available | |
| Patino Enrique Flores | $277,000 | Fidelity National Title Co | |
| Flores Guadalupe C | -- | None Available |
Source: Public Records
Mortgage History
| Date | Status | Borrower | Loan Amount |
|---|---|---|---|
| Open | Flores Enrique | $270,000 | |
| Closed | Patino Enrique Flores | $273,319 |
Source: Public Records
Tax History
| Year | Tax Paid | Tax Assessment Tax Assessment Total Assessment is a certain percentage of the fair market value that is determined by local assessors to be the total taxable value of land and additions on the property. | Land | Improvement |
|---|---|---|---|---|
| 2025 | $4,040 | $336,888 | $168,445 | $168,443 |
| 2024 | $4,040 | $330,283 | $165,142 | $165,141 |
| 2023 | $3,803 | $323,807 | $161,904 | $161,903 |
| 2022 | $3,725 | $317,458 | $158,729 | $158,729 |
| 2021 | $3,772 | $311,234 | $155,617 | $155,617 |
| 2020 | $3,841 | $308,044 | $154,022 | $154,022 |
| 2019 | $3,726 | $302,004 | $151,002 | $151,002 |
| 2018 | $3,589 | $296,084 | $148,042 | $148,042 |
| 2017 | $3,473 | $290,280 | $145,140 | $145,140 |
| 2016 | $3,308 | $284,590 | $142,295 | $142,295 |
| 2015 | $3,359 | $280,316 | $140,158 | $140,158 |
| 2014 | $3,298 | $274,826 | $137,413 | $137,413 |
Source: Public Records
Map
Nearby Homes
- 1140 Teakwood St
- 3638 S B St
- 225 W Iris St
- 2024 S J St
- 3820 S J St
- 3631 La Costa Place
- 140 Gaviota Place Unit 157
- 1431 Casa San Carlos Ln Unit B
- 4029 S B St
- 360 Ibsen Place Unit 129
- 3151 Fournier St
- 505 Pearson Rd
- 3130 Paula St
- 280 Columbia Place Unit 48
- 558 E Hemlock St
- 4160 Petit Dr Unit 39
- 236 E Bay Blvd
- 269 E Elfin Green
- 257 E Garden Green
- 4221 Justin Way
- 460 Redwood St
- 478 Redwood St
- 469 Spruce St
- 450 Redwood St
- 508 Redwood St
- 479 Spruce St
- 461 Spruce St
- 461 Redwood St
- 501 Redwood St
- 509 Spruce St
- 451 Spruce St
- 442 Redwood St
- 518 Redwood St
- 511 Redwood St
- 441 Redwood St
- 443 Spruce St
- 519 Spruce St
- 440 W Channel Islands Blvd
- 521 Redwood St
- 432 Redwood St
Your Personal Tour Guide
Ask me questions while you tour the home.