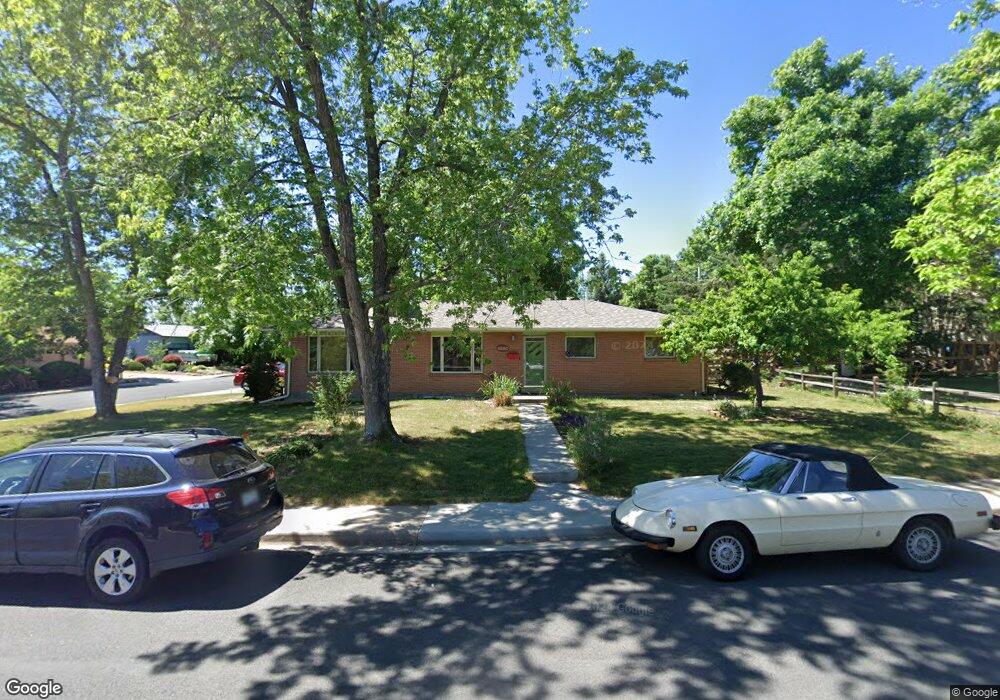
4680 Ludlow St Boulder, CO 80305
South Boulder NeighborhoodEstimated Value: $1,047,378 - $1,340,000
3
Beds
2
Baths
1,500
Sq Ft
$785/Sq Ft
Est. Value
About This Home
This home is located at 4680 Ludlow St, Boulder, CO 80305 and is currently estimated at $1,177,345, approximately $784 per square foot. 4680 Ludlow St is a home located in Boulder County with nearby schools including Creekside Elementary School, Southern Hills Middle School, and Fairview High School.
Ownership History
Date
Name
Owned For
Owner Type
Purchase Details
Closed on
Apr 23, 2019
Sold by
Sager Sarah
Bought by
Sager Sarah
Current Estimated Value
Home Financials for this Owner
Home Financials are based on the most recent Mortgage that was taken out on this home.
Original Mortgage
$275,000
Outstanding Balance
$241,774
Interest Rate
4.3%
Mortgage Type
New Conventional
Estimated Equity
$935,571
Purchase Details
Closed on
May 31, 2001
Sold by
Coble Richard D
Bought by
Sager Sarah and Sager Zach
Home Financials for this Owner
Home Financials are based on the most recent Mortgage that was taken out on this home.
Original Mortgage
$248,000
Interest Rate
7.07%
Purchase Details
Closed on
Jul 6, 1992
Bought by
Sager Sarah and Sager Zach
Purchase Details
Closed on
Jul 8, 1980
Bought by
Sager Sarah and Sager Zach
Create a Home Valuation Report for This Property
The Home Valuation Report is an in-depth analysis detailing your home's value as well as a comparison with similar homes in the area
Home Values in the Area
Average Home Value in this Area
Purchase History
| Date | Buyer | Sale Price | Title Company |
|---|---|---|---|
| Sager Sarah | -- | None Available | |
| Sager Sarah | $310,000 | -- | |
| Sager Sarah | -- | -- | |
| Sager Sarah | $76,900 | -- |
Source: Public Records
Mortgage History
| Date | Status | Borrower | Loan Amount |
|---|---|---|---|
| Open | Sager Sarah | $275,000 | |
| Closed | Sager Sarah | $248,000 |
Source: Public Records
Tax History
| Year | Tax Paid | Tax Assessment Tax Assessment Total Assessment is a certain percentage of the fair market value that is determined by local assessors to be the total taxable value of land and additions on the property. | Land | Improvement |
|---|---|---|---|---|
| 2025 | $6,243 | $65,144 | $36,163 | $28,981 |
| 2024 | $6,243 | $65,144 | $36,163 | $28,981 |
| 2023 | $6,134 | $71,033 | $42,733 | $31,986 |
| 2022 | $5,324 | $57,330 | $31,810 | $25,520 |
| 2021 | $5,077 | $58,981 | $32,726 | $26,255 |
| 2020 | $4,865 | $55,885 | $30,960 | $24,925 |
| 2019 | $4,790 | $55,885 | $30,960 | $24,925 |
| 2018 | $4,338 | $50,033 | $28,512 | $21,521 |
| 2017 | $4,202 | $55,314 | $31,522 | $23,792 |
| 2016 | $3,806 | $43,963 | $19,820 | $24,143 |
| 2015 | $3,604 | $36,027 | $13,691 | $22,336 |
| 2014 | $3,029 | $36,027 | $13,691 | $22,336 |
Source: Public Records
Map
Nearby Homes
- 4630 MacKy Way
- 4445 Squires Cir
- 4445 Grinnell Ave
- 1516 Chambers Dr
- 4380 Ludlow St
- 860 W Moorhead Cir Unit 2K
- 860 W Moorhead Cir Unit 1I
- 860 W Moorhead Cir Unit 2H
- 800 W Moorhead Cir Unit E
- 1596 Bradley Dr Unit 105C
- 750 W Moorhead Cir Unit A
- 4763 Tantra Dr Unit B
- 725 S 45th St
- 4286 Greenbriar Blvd
- 4204 Greenbriar Blvd Unit 45
- 1720 S Marshall Rd Unit 41
- 1720 S Marshall Rd Unit 26
- 3970 Longwood Ave
- 3490 Emerson Ave
- 3450 Emerson Ave
- 4670 Ludlow St
- 1207 Aikins Way
- 1200 Aikins Way
- 4685 Ludlow St
- 4660 Ludlow St
- 1215 Aikins Way
- 4675 Ludlow St
- 1206 Aikins Way
- 1210 Aikins Way
- 4665 Ludlow St
- 4692 Gordon Dr
- 4720 Ludlow St
- 4695 Gordon Dr
- 1216 Aikins Way
- 1223 Aikins Way
- 4650 Ludlow St
- 4687 Gordon Dr
- 4682 Gordon Dr
- 4645 Ludlow St
- 4740 Ludlow St
Your Personal Tour Guide
Ask me questions while you tour the home.