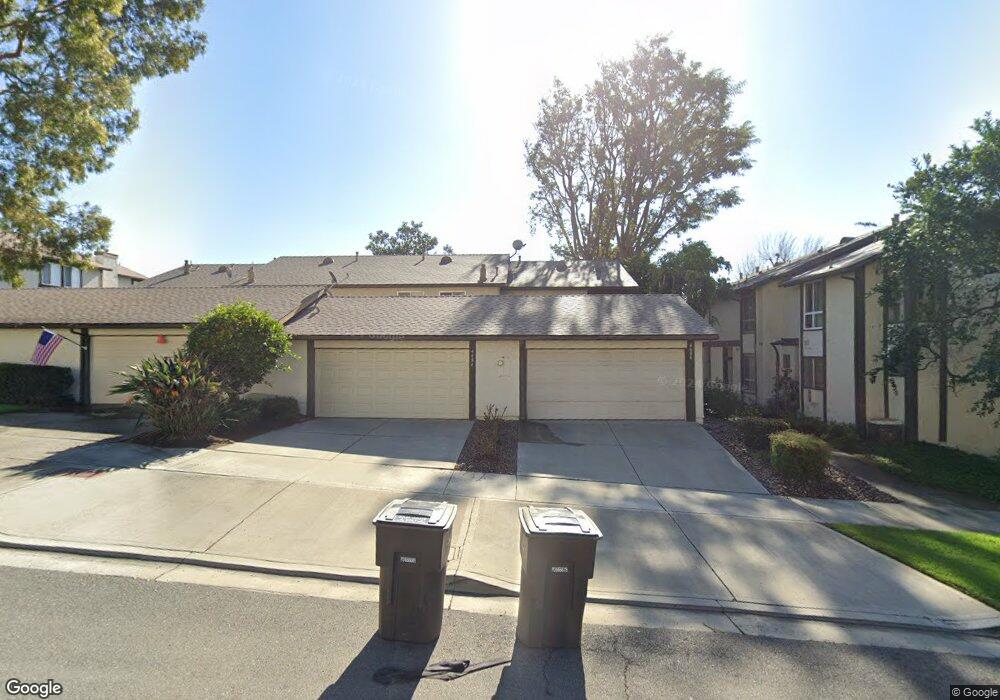
4684 Maxwell Ct Riverside, CA 92501
Downtown Riverside NeighborhoodEstimated Value: $348,000 - $404,371
3
Beds
3
Baths
1,049
Sq Ft
$364/Sq Ft
Est. Value
About This Home
This home is located at 4684 Maxwell Ct, Riverside, CA 92501 and is currently estimated at $382,093, approximately $364 per square foot. 4684 Maxwell Ct is a home located in Riverside County with nearby schools including Magnolia Elementary School, Central Middle School, and Polytechnic High School.
Ownership History
Date
Name
Owned For
Owner Type
Purchase Details
Closed on
Jul 13, 1998
Sold by
Potter Norman D
Bought by
Potter Rheta A
Current Estimated Value
Home Financials for this Owner
Home Financials are based on the most recent Mortgage that was taken out on this home.
Original Mortgage
$85,890
Outstanding Balance
$17,424
Interest Rate
6.9%
Mortgage Type
FHA
Estimated Equity
$364,669
Create a Home Valuation Report for This Property
The Home Valuation Report is an in-depth analysis detailing your home's value as well as a comparison with similar homes in the area
Home Values in the Area
Average Home Value in this Area
Purchase History
| Date | Buyer | Sale Price | Title Company |
|---|---|---|---|
| Potter Rheta A | -- | First American Title Ins Co | |
| Henderson Joelle | $86,000 | First American Title Ins Co |
Source: Public Records
Mortgage History
| Date | Status | Borrower | Loan Amount |
|---|---|---|---|
| Open | Henderson Joelle | $85,890 |
Source: Public Records
Tax History
| Year | Tax Paid | Tax Assessment Tax Assessment Total Assessment is a certain percentage of the fair market value that is determined by local assessors to be the total taxable value of land and additions on the property. | Land | Improvement |
|---|---|---|---|---|
| 2025 | $1,137 | $101,869 | $23,498 | $78,371 |
| 2023 | $1,137 | $97,916 | $22,587 | $75,329 |
| 2022 | $1,112 | $95,997 | $22,145 | $73,852 |
| 2021 | $1,112 | $94,115 | $21,711 | $72,404 |
| 2020 | $1,104 | $93,151 | $21,489 | $71,662 |
| 2019 | $1,086 | $91,325 | $21,068 | $70,257 |
| 2018 | $1,065 | $89,535 | $20,655 | $68,880 |
| 2017 | $1,047 | $87,780 | $20,250 | $67,530 |
| 2016 | $983 | $86,059 | $19,853 | $66,206 |
| 2015 | $970 | $84,767 | $19,555 | $65,212 |
| 2014 | $968 | $83,109 | $19,173 | $63,936 |
Source: Public Records
Map
Nearby Homes
- 4816 Gregory Rd
- 4490 Highland Place
- 4474 Highland Place
- 4481 13th St
- 4227 Miramonte Place
- 3985 Rice Rd
- 5012 Brockton Ave
- 5382 Tower Rd
- 4415 12th St
- 4096 Pine St
- 4073 Cedar St
- 4600 9th St
- 4735 Oakwood Place
- 4032 Elmwood Ct
- 4685 Rosewood Place
- 3979 Bandini Ave
- 4280 9th St
- 4160 Chestnut St
- 5604 Tower Rd
- 5184 Westerfield St
- 4686 Maxwell Ct
- 4682 Maxwell Ct
- 4685 Knickerbocker Ln
- 4680 Maxwell Ct
- 4698 Maxwell Ct
- 4696 Maxwell Ct
- 4683 Knickerbocker Ln
- 4679 Knickerbocker Ln
- 4681 Knickerbocker Ln
- 4692 Maxwell Ct
- 4677 Knickerbocker Ln
- 4694 Maxwell Ct
- 4672 Maxwell Ct
- 4707 Knickerbocker Ln
- 4712 Maxwell Ct
- 4670 Maxwell Ct
- 4711 Knickerbocker Ln
- 4671 Knickerbocker Ln
- 4715 Knickerbocker Ln
- 4705 Maxwell Ct
Your Personal Tour Guide
Ask me questions while you tour the home.