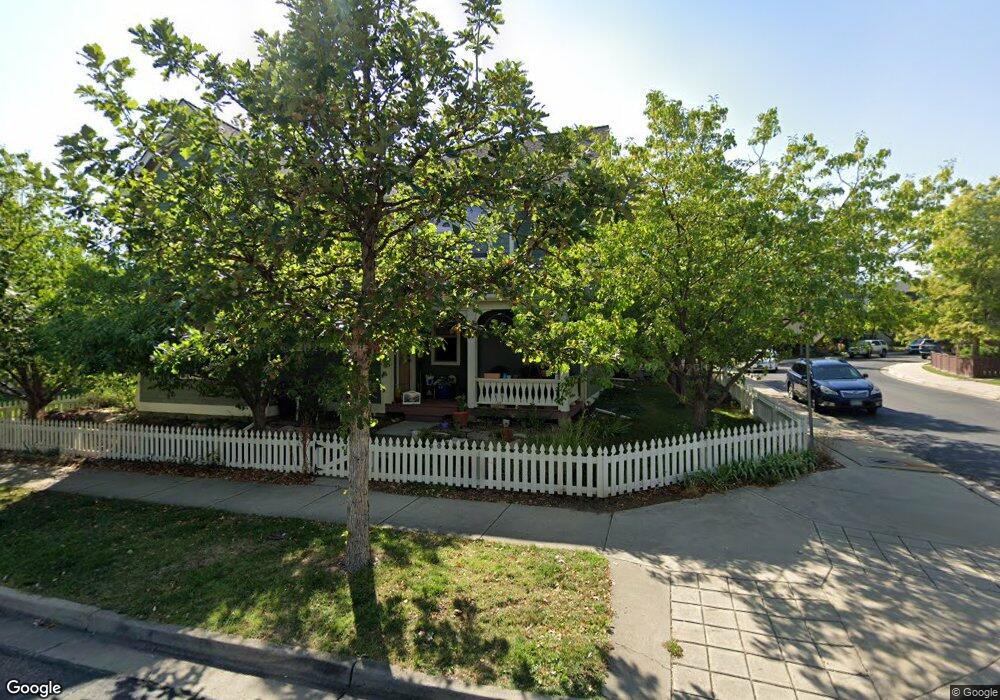
4695 16th St Unit 3 Boulder, CO 80304
North Boulder NeighborhoodEstimated Value: $296,844 - $550,000
3
Beds
3
Baths
1,560
Sq Ft
$272/Sq Ft
Est. Value
About This Home
This home is located at 4695 16th St Unit 3, Boulder, CO 80304 and is currently estimated at $424,961, approximately $272 per square foot. 4695 16th St Unit 3 is a home located in Boulder County with nearby schools including Crest View Elementary School, Centennial Middle School, and Boulder High School.
Ownership History
Date
Name
Owned For
Owner Type
Purchase Details
Closed on
Jul 31, 2012
Sold by
Ravisankar Angayarkanni and Appavoo Angai S
Bought by
Appavoo Angai S
Current Estimated Value
Purchase Details
Closed on
Nov 10, 2011
Sold by
Risard Mary
Bought by
Ravisankar Angayarkanni
Home Financials for this Owner
Home Financials are based on the most recent Mortgage that was taken out on this home.
Original Mortgage
$199,163
Outstanding Balance
$131,477
Interest Rate
3.37%
Mortgage Type
Adjustable Rate Mortgage/ARM
Estimated Equity
$293,484
Purchase Details
Closed on
May 6, 2004
Sold by
Affordable Housing Alliance Inc
Bought by
Risard Mary
Home Financials for this Owner
Home Financials are based on the most recent Mortgage that was taken out on this home.
Original Mortgage
$150,320
Interest Rate
5.38%
Mortgage Type
Purchase Money Mortgage
Create a Home Valuation Report for This Property
The Home Valuation Report is an in-depth analysis detailing your home's value as well as a comparison with similar homes in the area
Home Values in the Area
Average Home Value in this Area
Purchase History
| Date | Buyer | Sale Price | Title Company |
|---|---|---|---|
| Appavoo Angai S | -- | None Available | |
| Ravisankar Angayarkanni | $212,618 | Guardian Title | |
| Risard Mary | $187,900 | -- |
Source: Public Records
Mortgage History
| Date | Status | Borrower | Loan Amount |
|---|---|---|---|
| Open | Ravisankar Angayarkanni | $199,163 | |
| Previous Owner | Risard Mary | $150,320 | |
| Closed | Risard Mary | $10 |
Source: Public Records
Tax History
| Year | Tax Paid | Tax Assessment Tax Assessment Total Assessment is a certain percentage of the fair market value that is determined by local assessors to be the total taxable value of land and additions on the property. | Land | Improvement |
|---|---|---|---|---|
| 2025 | $1,136 | $16,377 | -- | $16,377 |
| 2024 | $1,136 | $16,377 | -- | $16,377 |
| 2023 | $1,116 | $12,923 | -- | $16,608 |
| 2022 | $1,548 | $16,672 | $0 | $16,672 |
| 2021 | $1,476 | $17,152 | $0 | $17,152 |
| 2020 | $1,429 | $16,416 | $0 | $16,416 |
| 2019 | $1,407 | $16,416 | $0 | $16,416 |
| 2018 | $1,371 | $15,811 | $0 | $15,811 |
| 2017 | $1,328 | $17,480 | $0 | $17,480 |
| 2016 | $1,448 | $16,724 | $0 | $16,724 |
| 2015 | $1,371 | $16,230 | $0 | $16,230 |
| 2014 | $1,365 | $16,230 | $0 | $16,230 |
Source: Public Records
Map
Nearby Homes
- 4730 Holiday Dr Unit 101
- 1455 Yarmouth Ave Unit 211
- 1707 Yarmouth Ave Unit 108
- 4621 18th St Unit B6
- 4585 13th St Unit 1
- 4555 13th St Unit 2-C
- 4555 13th St Unit 2A
- 1310 Rosewood Ave Unit 5-A
- 4520 Broadway St Unit 207
- 4500 19th St Unit 111
- 4500 19th St Unit 366
- 4500 19th St
- 4500 19th St Unit 178
- 835 Yellow Pine Ave
- 1170 Violet Ave
- 1160 Violet Ave
- 4371 Broadway
- 1150 Violet Ave
- 1140 Violet Ave
- 1130 Violet Ave
- 4663 16th St Unit 11
- 4655 16th St Unit 8
- 4671 16th St Unit 9
- 1550 Easy Rider Ln Unit 12
- 1585 Yaupon Ave
- 4651 16th St
- 4667 16th St Unit 2
- 4650 Holiday Dr Unit 302
- 4650 Holiday Dr Unit 204
- 4650 Holiday Dr Unit 203
- 4650 Holiday Dr Unit 202
- 4650 Holiday Dr Unit 201
- 4650 Holiday Dr Unit 104
- 4650 Holiday Dr Unit 103
- 4650 Holiday Dr Unit 102
- 4650 Holiday Dr Unit 101
- 4683 16th St Unit 1
- 1582 Yaupon Ave
- 1580 Yaupon Ave
- 1590 Yaupon Ave
Your Personal Tour Guide
Ask me questions while you tour the home.