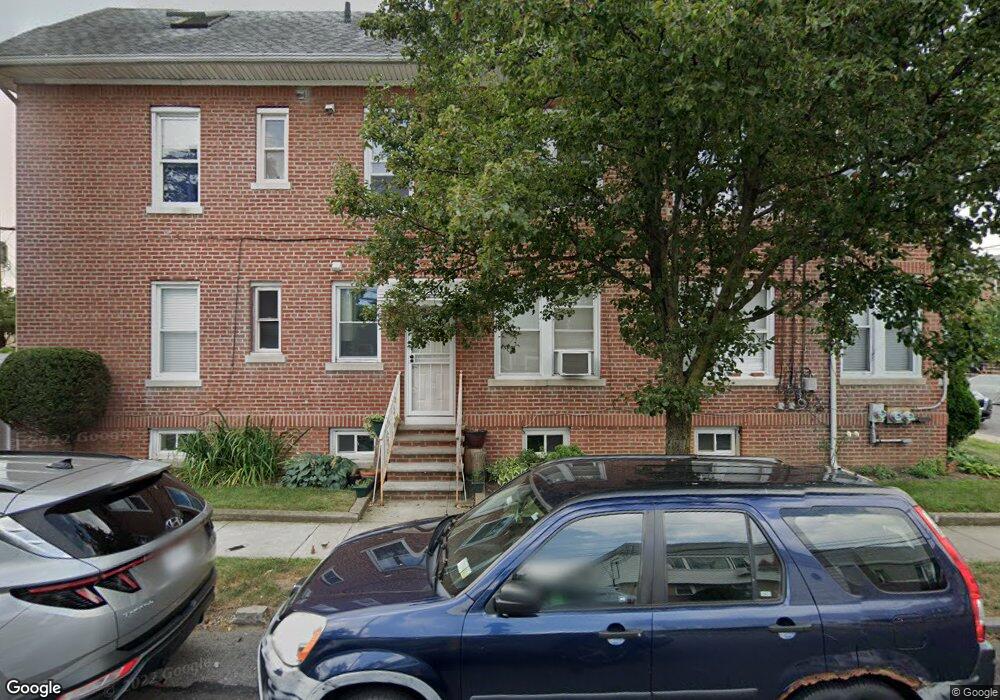
47-01 163rd St Unit 1 F Flushing, NY 11358
Flushing NeighborhoodEstimated Value: $1,152,000 - $1,489,000
--
Bed
1
Bath
2,394
Sq Ft
$545/Sq Ft
Est. Value
About This Home
This home is located at 47-01 163rd St Unit 1 F, Flushing, NY 11358 and is currently estimated at $1,304,142, approximately $544 per square foot. 47-01 163rd St Unit 1 F is a home located in Queens County with nearby schools including Rachel Carson I.S. 237Q, Francis Lewis High School, and St. Andrew Avellino Catholic Academy.
Ownership History
Date
Name
Owned For
Owner Type
Purchase Details
Closed on
Jul 30, 2020
Sold by
Carcamo Blanca A
Bought by
Blare & R Llc
Current Estimated Value
Purchase Details
Closed on
Apr 13, 2016
Sold by
Sferrazza James
Bought by
Carcamo Blanca A
Purchase Details
Closed on
Mar 23, 2005
Sold by
Diaz Christina and Gago Rafael M
Bought by
Sferraza James
Home Financials for this Owner
Home Financials are based on the most recent Mortgage that was taken out on this home.
Original Mortgage
$564,000
Interest Rate
5.7%
Mortgage Type
Purchase Money Mortgage
Purchase Details
Closed on
Sep 16, 2002
Sold by
Diaz Joanne
Bought by
Diaz Christina and Gago Rafael M
Purchase Details
Closed on
Jan 18, 2000
Sold by
Cale Josip and Cale Iva
Bought by
Diaz Joanne
Home Financials for this Owner
Home Financials are based on the most recent Mortgage that was taken out on this home.
Original Mortgage
$257,400
Interest Rate
8.11%
Create a Home Valuation Report for This Property
The Home Valuation Report is an in-depth analysis detailing your home's value as well as a comparison with similar homes in the area
Home Values in the Area
Average Home Value in this Area
Purchase History
| Date | Buyer | Sale Price | Title Company |
|---|---|---|---|
| Blare & R Llc | -- | -- | |
| Carcamo Blanca A | $705,000 | -- | |
| Sferraza James | $705,000 | -- | |
| Diaz Christina | -- | -- | |
| Diaz Joanne | $286,000 | Commonwealth Land Title Ins |
Source: Public Records
Mortgage History
| Date | Status | Borrower | Loan Amount |
|---|---|---|---|
| Previous Owner | Sferraza James | $564,000 | |
| Previous Owner | Diaz Joanne | $257,400 |
Source: Public Records
Tax History Compared to Growth
Tax History
| Year | Tax Paid | Tax Assessment Tax Assessment Total Assessment is a certain percentage of the fair market value that is determined by local assessors to be the total taxable value of land and additions on the property. | Land | Improvement |
|---|---|---|---|---|
| 2025 | $8,604 | $45,404 | $11,748 | $33,656 |
| 2024 | $8,604 | $42,836 | $10,408 | $32,428 |
| 2023 | $8,490 | $41,803 | $10,166 | $31,637 |
| 2022 | $8,345 | $74,880 | $18,180 | $56,700 |
| 2021 | $8,440 | $65,760 | $18,180 | $47,580 |
| 2020 | $8,009 | $72,300 | $18,180 | $54,120 |
| 2019 | $7,467 | $61,920 | $18,180 | $43,740 |
| 2018 | $7,101 | $34,836 | $13,925 | $20,911 |
| 2017 | $7,101 | $34,836 | $14,930 | $19,906 |
| 2016 | $6,681 | $34,836 | $14,930 | $19,906 |
| 2015 | $3,964 | $31,531 | $16,920 | $14,611 |
| 2014 | $3,964 | $29,748 | $19,023 | $10,725 |
Source: Public Records
Map
Nearby Homes
- 162-19 Laburnum Ave
- 47-18 163rd St
- 47-23 164th St
- 4620 161st St Unit B2
- 46-12 161st St Unit 1D
- 46-12 161st St Unit 3B
- 47-04 167th St
- 157-51 Rose Ave
- 45-35 163rd St
- 157-18 Laburnum Ave
- 45-57 160th St
- 4547 166th St
- 46-05 158th St
- 46-43 157th St
- 16622 Metcalf Ave
- 45-14 161st St
- 45-11 160th St
- 4919 169th St
- 16471 Underhill Ave
- 16475 Underhill Ave
- 4703 163rd St
- 4701 163rd St
- 4707 163rd St
- 4711 163rd St
- 163-12 Pidgeon Meadow Rd
- 16312 Pidgeon Meadow Rd
- 16229 Laburnum Ave
- 4717 163rd St
- 162-25 Laburnum Ave
- 16225 Laburnum Ave
- 162-19 Laburnum Ave Unit 2
- 162-19 Laburnum Ave Unit 3
- 4704 163rd St
- 16316 Pidgeon Meadow Rd
- 4719 163rd St
- 4719 163rd St
- 47-04 163rd St
- 4704 163rd St
- 16216 Laburnum Ave
- 4706 163rd St