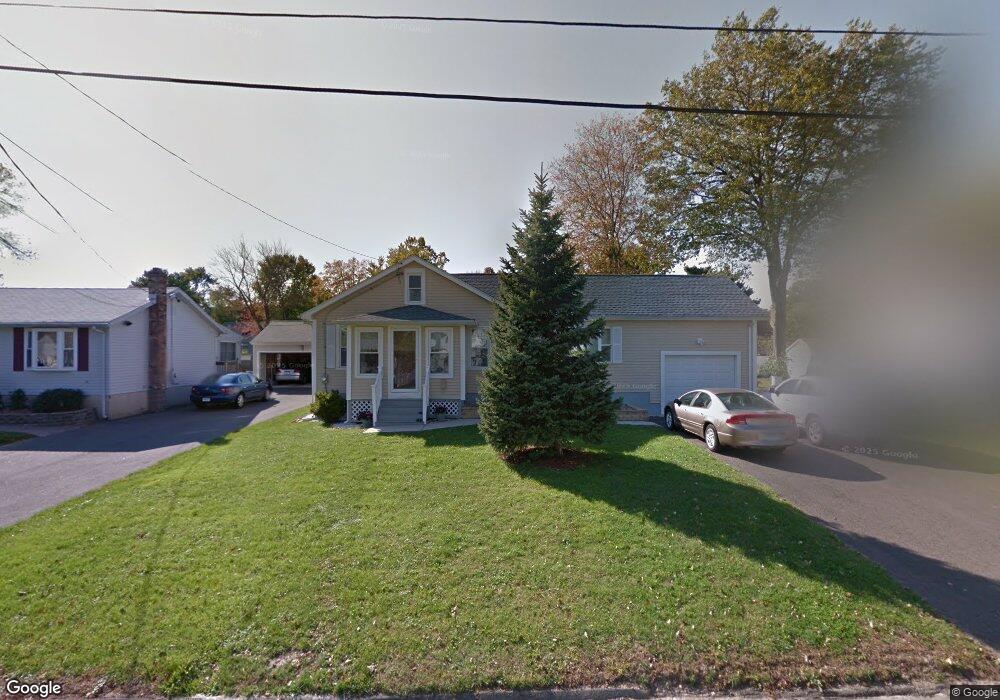
47 Carson Ave Wethersfield, CT 06109
Estimated Value: $300,000 - $330,000
3
Beds
1
Bath
1,220
Sq Ft
$258/Sq Ft
Est. Value
About This Home
This home is located at 47 Carson Ave, Wethersfield, CT 06109 and is currently estimated at $314,966, approximately $258 per square foot. 47 Carson Ave is a home located in Hartford County with nearby schools including Emerson-Williams School, Silas Deane Middle School, and Wethersfield High School.
Ownership History
Date
Name
Owned For
Owner Type
Purchase Details
Closed on
Sep 18, 2006
Sold by
Smith Scott D
Bought by
Gobeljic Muriz and Gobeljic Refija
Current Estimated Value
Home Financials for this Owner
Home Financials are based on the most recent Mortgage that was taken out on this home.
Original Mortgage
$178,489
Interest Rate
6.71%
Purchase Details
Closed on
Nov 9, 2000
Sold by
Assets Usa Llc
Bought by
227 Main St Llc
Create a Home Valuation Report for This Property
The Home Valuation Report is an in-depth analysis detailing your home's value as well as a comparison with similar homes in the area
Home Values in the Area
Average Home Value in this Area
Purchase History
| Date | Buyer | Sale Price | Title Company |
|---|---|---|---|
| Gobeljic Muriz | $179,900 | -- | |
| 227 Main St Llc | $435,000 | -- |
Source: Public Records
Mortgage History
| Date | Status | Borrower | Loan Amount |
|---|---|---|---|
| Open | 227 Main St Llc | $170,400 | |
| Closed | 227 Main St Llc | $10,650 | |
| Closed | 227 Main St Llc | $178,489 |
Source: Public Records
Tax History
| Year | Tax Paid | Tax Assessment Tax Assessment Total Assessment is a certain percentage of the fair market value that is determined by local assessors to be the total taxable value of land and additions on the property. | Land | Improvement |
|---|---|---|---|---|
| 2025 | $6,779 | $164,460 | $69,260 | $95,200 |
| 2024 | $6,130 | $141,830 | $72,100 | $69,730 |
| 2023 | $5,926 | $141,830 | $72,100 | $69,730 |
| 2022 | $5,749 | $139,950 | $72,100 | $67,850 |
| 2021 | $5,692 | $139,950 | $72,100 | $67,850 |
| 2020 | $5,695 | $139,950 | $72,100 | $67,850 |
| 2019 | $5,702 | $139,950 | $72,100 | $67,850 |
| 2018 | $5,754 | $141,100 | $69,000 | $72,100 |
| 2017 | $5,612 | $141,100 | $69,000 | $72,100 |
| 2016 | $5,438 | $141,100 | $69,000 | $72,100 |
| 2015 | $5,389 | $141,100 | $69,000 | $72,100 |
| 2014 | $5,184 | $141,100 | $69,000 | $72,100 |
Source: Public Records
Map
Nearby Homes
- 1 Bristol St
- 19 Albert Ave
- 295 Ridge Rd Unit 8
- 192 Wolcott Hill Rd
- 219-221 Jordan Ln
- 173 Timber Trail
- 273 Forest Dr
- 20 Forest Dr
- 23 Hillcrest Ave
- 764 Ridge Rd
- 129 Goff Rd
- 18 Avalon Place
- 107 Harmund Place
- 35 Kingston St
- 158 Dix Rd
- 87 Somerset St
- 91 Somerset St
- 62 Schoolhouse Crossing
- 1 Fernwood St
- 317-319 Garden St
Your Personal Tour Guide
Ask me questions while you tour the home.